Chippewa vs Spanish American Indian Median Male Earnings
COMPARE
Chippewa
Spanish American Indian
Median Male Earnings
Median Male Earnings Comparison
Chippewa
Spanish American Indians
$46,368
MEDIAN MALE EARNINGS
0.0/ 100
METRIC RATING
314th/ 347
METRIC RANK
$44,010
MEDIAN MALE EARNINGS
0.0/ 100
METRIC RATING
335th/ 347
METRIC RANK
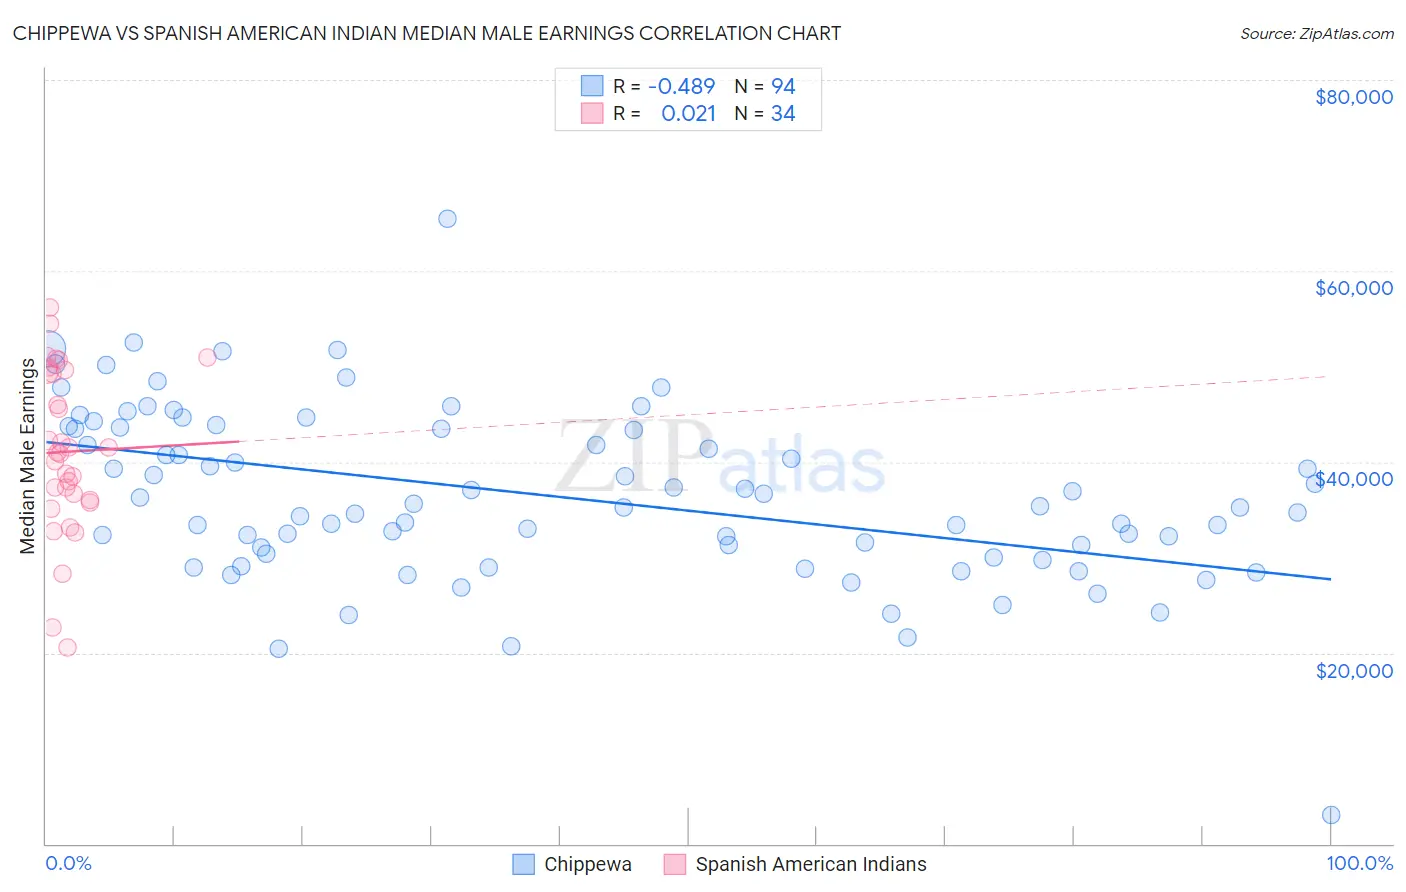
Chippewa vs Spanish American Indian Median Male Earnings Correlation Chart
The statistical analysis conducted on geographies consisting of 215,007,267 people shows a moderate negative correlation between the proportion of Chippewa and median male earnings in the United States with a correlation coefficient (R) of -0.489 and weighted average of $46,368. Similarly, the statistical analysis conducted on geographies consisting of 73,148,083 people shows no correlation between the proportion of Spanish American Indians and median male earnings in the United States with a correlation coefficient (R) of 0.021 and weighted average of $44,010, a difference of 5.4%.
Median Male Earnings Correlation Summary
| Measurement | Chippewa | Spanish American Indian |
| Minimum | $3,000 | $20,599 |
| Maximum | $65,417 | $56,169 |
| Range | $62,417 | $35,570 |
| Mean | $36,432 | $41,061 |
| Median | $35,290 | $40,899 |
| Interquartile 25% (IQ1) | $30,344 | $35,978 |
| Interquartile 75% (IQ3) | $43,504 | $49,409 |
| Interquartile Range (IQR) | $13,160 | $13,431 |
| Standard Deviation (Sample) | $9,091 | $8,549 |
| Standard Deviation (Population) | $9,042 | $8,423 |
Similar Demographics by Median Male Earnings
Demographics Similar to Chippewa by Median Male Earnings
In terms of median male earnings, the demographic groups most similar to Chippewa are Honduran ($46,374, a difference of 0.010%), Hispanic or Latino ($46,419, a difference of 0.11%), Apache ($46,429, a difference of 0.13%), Immigrants from Guatemala ($46,244, a difference of 0.27%), and Immigrants from Caribbean ($46,193, a difference of 0.38%).
| Demographics | Rating | Rank | Median Male Earnings |
| Immigrants | Dominican Republic | 0.0 /100 | #307 | Tragic $46,655 |
| Ottawa | 0.0 /100 | #308 | Tragic $46,611 |
| Creek | 0.0 /100 | #309 | Tragic $46,594 |
| Cubans | 0.0 /100 | #310 | Tragic $46,580 |
| Apache | 0.0 /100 | #311 | Tragic $46,429 |
| Hispanics or Latinos | 0.0 /100 | #312 | Tragic $46,419 |
| Hondurans | 0.0 /100 | #313 | Tragic $46,374 |
| Chippewa | 0.0 /100 | #314 | Tragic $46,368 |
| Immigrants | Guatemala | 0.0 /100 | #315 | Tragic $46,244 |
| Immigrants | Caribbean | 0.0 /100 | #316 | Tragic $46,193 |
| Mexicans | 0.0 /100 | #317 | Tragic $46,147 |
| Cheyenne | 0.0 /100 | #318 | Tragic $46,062 |
| Haitians | 0.0 /100 | #319 | Tragic $45,903 |
| Immigrants | Honduras | 0.0 /100 | #320 | Tragic $45,787 |
| Fijians | 0.0 /100 | #321 | Tragic $45,607 |
Demographics Similar to Spanish American Indians by Median Male Earnings
In terms of median male earnings, the demographic groups most similar to Spanish American Indians are Immigrants from Yemen ($44,083, a difference of 0.17%), Immigrants from Congo ($44,204, a difference of 0.44%), Immigrants from Cuba ($43,461, a difference of 1.3%), Bahamian ($44,756, a difference of 1.7%), and Native/Alaskan ($44,775, a difference of 1.7%).
| Demographics | Rating | Rank | Median Male Earnings |
| Kiowa | 0.0 /100 | #328 | Tragic $45,094 |
| Yakama | 0.0 /100 | #329 | Tragic $45,002 |
| Immigrants | Mexico | 0.0 /100 | #330 | Tragic $44,960 |
| Natives/Alaskans | 0.0 /100 | #331 | Tragic $44,775 |
| Bahamians | 0.0 /100 | #332 | Tragic $44,756 |
| Immigrants | Congo | 0.0 /100 | #333 | Tragic $44,204 |
| Immigrants | Yemen | 0.0 /100 | #334 | Tragic $44,083 |
| Spanish American Indians | 0.0 /100 | #335 | Tragic $44,010 |
| Immigrants | Cuba | 0.0 /100 | #336 | Tragic $43,461 |
| Menominee | 0.0 /100 | #337 | Tragic $42,581 |
| Crow | 0.0 /100 | #338 | Tragic $42,434 |
| Pima | 0.0 /100 | #339 | Tragic $42,357 |
| Navajo | 0.0 /100 | #340 | Tragic $42,098 |
| Hopi | 0.0 /100 | #341 | Tragic $42,060 |
| Arapaho | 0.0 /100 | #342 | Tragic $41,758 |