Chippewa vs Immigrants from Guyana Median Male Earnings
COMPARE
Chippewa
Immigrants from Guyana
Median Male Earnings
Median Male Earnings Comparison
Chippewa
Immigrants from Guyana
$46,368
MEDIAN MALE EARNINGS
0.0/ 100
METRIC RATING
314th/ 347
METRIC RANK
$50,321
MEDIAN MALE EARNINGS
1.6/ 100
METRIC RATING
248th/ 347
METRIC RANK
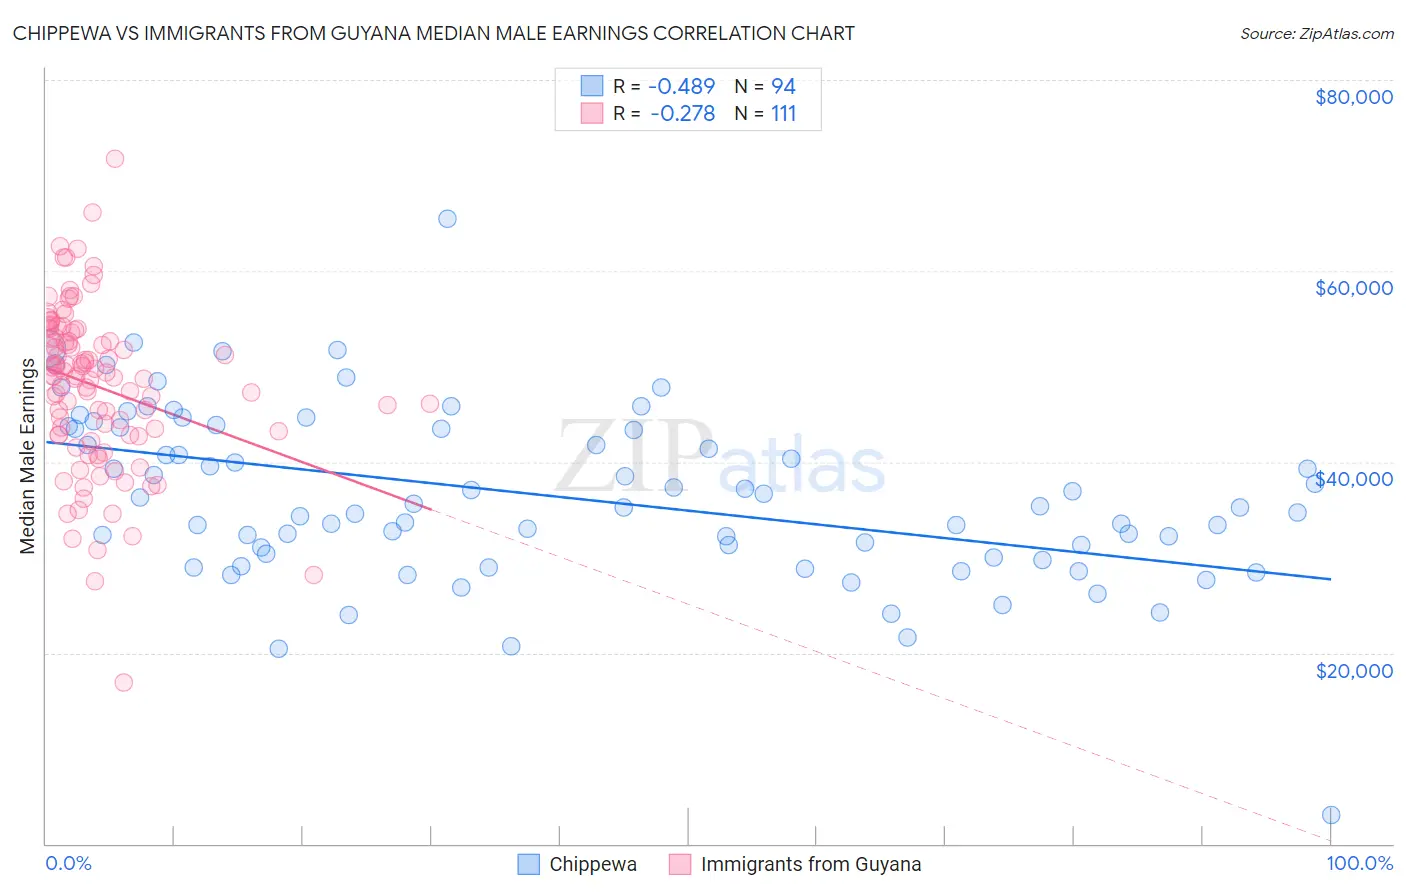
Chippewa vs Immigrants from Guyana Median Male Earnings Correlation Chart
The statistical analysis conducted on geographies consisting of 215,007,267 people shows a moderate negative correlation between the proportion of Chippewa and median male earnings in the United States with a correlation coefficient (R) of -0.489 and weighted average of $46,368. Similarly, the statistical analysis conducted on geographies consisting of 183,717,574 people shows a weak negative correlation between the proportion of Immigrants from Guyana and median male earnings in the United States with a correlation coefficient (R) of -0.278 and weighted average of $50,321, a difference of 8.5%.
Median Male Earnings Correlation Summary
| Measurement | Chippewa | Immigrants from Guyana |
| Minimum | $3,000 | $16,923 |
| Maximum | $65,417 | $71,805 |
| Range | $62,417 | $54,882 |
| Mean | $36,432 | $47,916 |
| Median | $35,290 | $49,022 |
| Interquartile 25% (IQ1) | $30,344 | $42,798 |
| Interquartile 75% (IQ3) | $43,504 | $53,585 |
| Interquartile Range (IQR) | $13,160 | $10,787 |
| Standard Deviation (Sample) | $9,091 | $8,575 |
| Standard Deviation (Population) | $9,042 | $8,536 |
Similar Demographics by Median Male Earnings
Demographics Similar to Chippewa by Median Male Earnings
In terms of median male earnings, the demographic groups most similar to Chippewa are Honduran ($46,374, a difference of 0.010%), Hispanic or Latino ($46,419, a difference of 0.11%), Apache ($46,429, a difference of 0.13%), Immigrants from Guatemala ($46,244, a difference of 0.27%), and Immigrants from Caribbean ($46,193, a difference of 0.38%).
| Demographics | Rating | Rank | Median Male Earnings |
| Immigrants | Dominican Republic | 0.0 /100 | #307 | Tragic $46,655 |
| Ottawa | 0.0 /100 | #308 | Tragic $46,611 |
| Creek | 0.0 /100 | #309 | Tragic $46,594 |
| Cubans | 0.0 /100 | #310 | Tragic $46,580 |
| Apache | 0.0 /100 | #311 | Tragic $46,429 |
| Hispanics or Latinos | 0.0 /100 | #312 | Tragic $46,419 |
| Hondurans | 0.0 /100 | #313 | Tragic $46,374 |
| Chippewa | 0.0 /100 | #314 | Tragic $46,368 |
| Immigrants | Guatemala | 0.0 /100 | #315 | Tragic $46,244 |
| Immigrants | Caribbean | 0.0 /100 | #316 | Tragic $46,193 |
| Mexicans | 0.0 /100 | #317 | Tragic $46,147 |
| Cheyenne | 0.0 /100 | #318 | Tragic $46,062 |
| Haitians | 0.0 /100 | #319 | Tragic $45,903 |
| Immigrants | Honduras | 0.0 /100 | #320 | Tragic $45,787 |
| Fijians | 0.0 /100 | #321 | Tragic $45,607 |
Demographics Similar to Immigrants from Guyana by Median Male Earnings
In terms of median male earnings, the demographic groups most similar to Immigrants from Guyana are Immigrants from Burma/Myanmar ($50,298, a difference of 0.050%), Osage ($50,292, a difference of 0.060%), Immigrants from Grenada ($50,279, a difference of 0.080%), Subsaharan African ($50,408, a difference of 0.17%), and Immigrants from Ecuador ($50,474, a difference of 0.30%).
| Demographics | Rating | Rank | Median Male Earnings |
| Immigrants | St. Vincent and the Grenadines | 2.3 /100 | #241 | Tragic $50,665 |
| Guyanese | 2.2 /100 | #242 | Tragic $50,613 |
| French American Indians | 2.2 /100 | #243 | Tragic $50,611 |
| Houma | 2.0 /100 | #244 | Tragic $50,547 |
| Hawaiians | 1.9 /100 | #245 | Tragic $50,488 |
| Immigrants | Ecuador | 1.9 /100 | #246 | Tragic $50,474 |
| Sub-Saharan Africans | 1.8 /100 | #247 | Tragic $50,408 |
| Immigrants | Guyana | 1.6 /100 | #248 | Tragic $50,321 |
| Immigrants | Burma/Myanmar | 1.6 /100 | #249 | Tragic $50,298 |
| Osage | 1.6 /100 | #250 | Tragic $50,292 |
| Immigrants | Grenada | 1.6 /100 | #251 | Tragic $50,279 |
| Immigrants | Cabo Verde | 1.2 /100 | #252 | Tragic $50,009 |
| German Russians | 1.1 /100 | #253 | Tragic $49,924 |
| Senegalese | 1.0 /100 | #254 | Tragic $49,774 |
| Alaskan Athabascans | 0.9 /100 | #255 | Tragic $49,748 |