Chippewa vs Macedonian Median Male Earnings
COMPARE
Chippewa
Macedonian
Median Male Earnings
Median Male Earnings Comparison
Chippewa
Macedonians
$46,368
MEDIAN MALE EARNINGS
0.0/ 100
METRIC RATING
314th/ 347
METRIC RANK
$59,522
MEDIAN MALE EARNINGS
99.3/ 100
METRIC RATING
87th/ 347
METRIC RANK
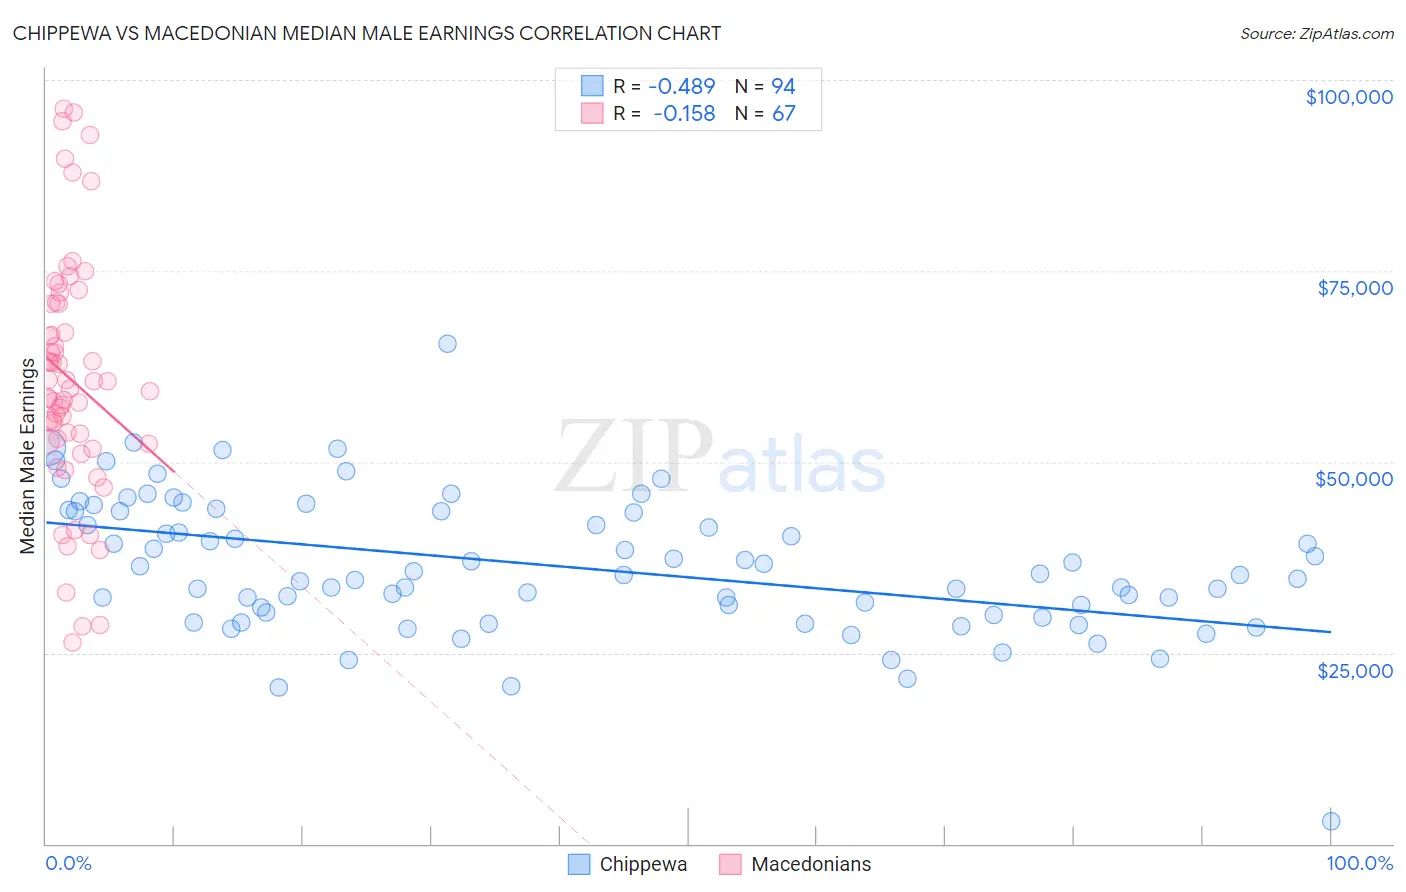
Chippewa vs Macedonian Median Male Earnings Correlation Chart
The statistical analysis conducted on geographies consisting of 215,007,267 people shows a moderate negative correlation between the proportion of Chippewa and median male earnings in the United States with a correlation coefficient (R) of -0.489 and weighted average of $46,368. Similarly, the statistical analysis conducted on geographies consisting of 132,576,101 people shows a poor negative correlation between the proportion of Macedonians and median male earnings in the United States with a correlation coefficient (R) of -0.158 and weighted average of $59,522, a difference of 28.4%.
Median Male Earnings Correlation Summary
| Measurement | Chippewa | Macedonian |
| Minimum | $3,000 | $26,375 |
| Maximum | $65,417 | $96,230 |
| Range | $62,417 | $69,855 |
| Mean | $36,432 | $60,888 |
| Median | $35,290 | $59,610 |
| Interquartile 25% (IQ1) | $30,344 | $52,559 |
| Interquartile 75% (IQ3) | $43,504 | $70,744 |
| Interquartile Range (IQR) | $13,160 | $18,185 |
| Standard Deviation (Sample) | $9,091 | $15,733 |
| Standard Deviation (Population) | $9,042 | $15,615 |
Similar Demographics by Median Male Earnings
Demographics Similar to Chippewa by Median Male Earnings
In terms of median male earnings, the demographic groups most similar to Chippewa are Honduran ($46,374, a difference of 0.010%), Hispanic or Latino ($46,419, a difference of 0.11%), Apache ($46,429, a difference of 0.13%), Immigrants from Guatemala ($46,244, a difference of 0.27%), and Immigrants from Caribbean ($46,193, a difference of 0.38%).
| Demographics | Rating | Rank | Median Male Earnings |
| Immigrants | Dominican Republic | 0.0 /100 | #307 | Tragic $46,655 |
| Ottawa | 0.0 /100 | #308 | Tragic $46,611 |
| Creek | 0.0 /100 | #309 | Tragic $46,594 |
| Cubans | 0.0 /100 | #310 | Tragic $46,580 |
| Apache | 0.0 /100 | #311 | Tragic $46,429 |
| Hispanics or Latinos | 0.0 /100 | #312 | Tragic $46,419 |
| Hondurans | 0.0 /100 | #313 | Tragic $46,374 |
| Chippewa | 0.0 /100 | #314 | Tragic $46,368 |
| Immigrants | Guatemala | 0.0 /100 | #315 | Tragic $46,244 |
| Immigrants | Caribbean | 0.0 /100 | #316 | Tragic $46,193 |
| Mexicans | 0.0 /100 | #317 | Tragic $46,147 |
| Cheyenne | 0.0 /100 | #318 | Tragic $46,062 |
| Haitians | 0.0 /100 | #319 | Tragic $45,903 |
| Immigrants | Honduras | 0.0 /100 | #320 | Tragic $45,787 |
| Fijians | 0.0 /100 | #321 | Tragic $45,607 |
Demographics Similar to Macedonians by Median Male Earnings
In terms of median male earnings, the demographic groups most similar to Macedonians are Immigrants from England ($59,527, a difference of 0.010%), Afghan ($59,554, a difference of 0.050%), Italian ($59,551, a difference of 0.050%), Immigrants from Argentina ($59,491, a difference of 0.050%), and Immigrants from Moldova ($59,417, a difference of 0.18%).
| Demographics | Rating | Rank | Median Male Earnings |
| Immigrants | Hungary | 99.5 /100 | #80 | Exceptional $59,806 |
| Ukrainians | 99.4 /100 | #81 | Exceptional $59,728 |
| Croatians | 99.4 /100 | #82 | Exceptional $59,715 |
| Immigrants | Italy | 99.4 /100 | #83 | Exceptional $59,691 |
| Afghans | 99.3 /100 | #84 | Exceptional $59,554 |
| Italians | 99.3 /100 | #85 | Exceptional $59,551 |
| Immigrants | England | 99.3 /100 | #86 | Exceptional $59,527 |
| Macedonians | 99.3 /100 | #87 | Exceptional $59,522 |
| Immigrants | Argentina | 99.3 /100 | #88 | Exceptional $59,491 |
| Immigrants | Moldova | 99.2 /100 | #89 | Exceptional $59,417 |
| Austrians | 99.2 /100 | #90 | Exceptional $59,359 |
| Laotians | 99.2 /100 | #91 | Exceptional $59,351 |
| Immigrants | Kazakhstan | 99.1 /100 | #92 | Exceptional $59,278 |
| Immigrants | Southern Europe | 99.0 /100 | #93 | Exceptional $59,217 |
| Immigrants | North Macedonia | 99.0 /100 | #94 | Exceptional $59,189 |