Cherokee vs Salvadoran Wage/Income Gap
COMPARE
Cherokee
Salvadoran
Wage/Income Gap
Wage/Income Gap Comparison
Cherokee
Salvadorans
27.4%
WAGE/INCOME GAP
1.9/ 100
METRIC RATING
256th/ 347
METRIC RANK
23.0%
WAGE/INCOME GAP
99.9/ 100
METRIC RATING
80th/ 347
METRIC RANK
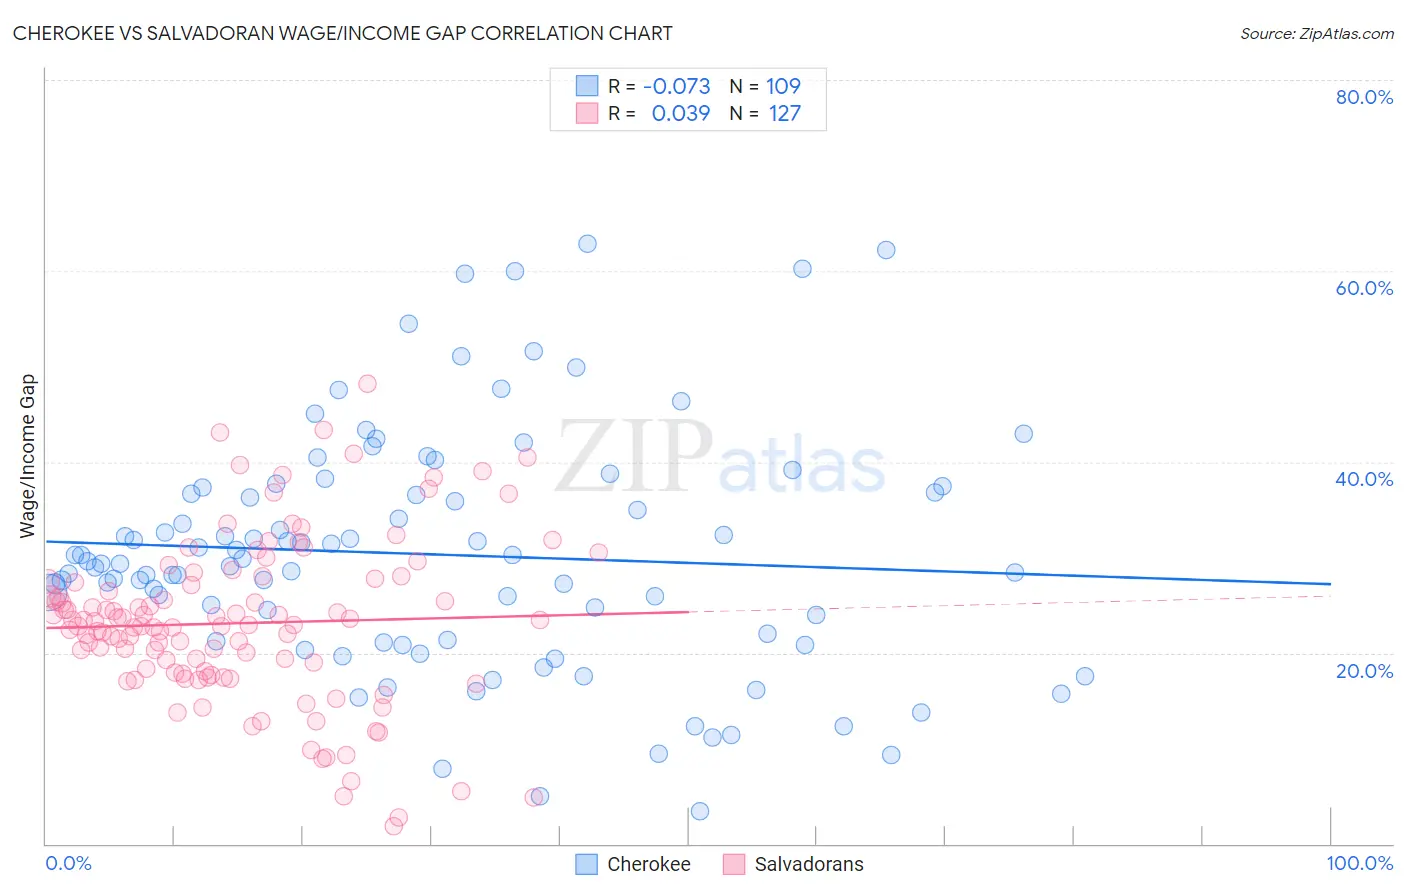
Cherokee vs Salvadoran Wage/Income Gap Correlation Chart
The statistical analysis conducted on geographies consisting of 492,544,110 people shows a slight negative correlation between the proportion of Cherokee and wage/income gap percentage in the United States with a correlation coefficient (R) of -0.073 and weighted average of 27.4%. Similarly, the statistical analysis conducted on geographies consisting of 398,802,169 people shows no correlation between the proportion of Salvadorans and wage/income gap percentage in the United States with a correlation coefficient (R) of 0.039 and weighted average of 23.0%, a difference of 19.2%.
Wage/Income Gap Correlation Summary
| Measurement | Cherokee | Salvadoran |
| Minimum | 3.4% | 1.8% |
| Maximum | 62.9% | 48.2% |
| Range | 59.5% | 46.5% |
| Mean | 30.3% | 23.1% |
| Median | 29.4% | 22.9% |
| Interquartile 25% (IQ1) | 21.3% | 18.0% |
| Interquartile 75% (IQ3) | 37.1% | 27.5% |
| Interquartile Range (IQR) | 15.8% | 9.5% |
| Standard Deviation (Sample) | 12.4% | 8.6% |
| Standard Deviation (Population) | 12.4% | 8.6% |
Similar Demographics by Wage/Income Gap
Demographics Similar to Cherokee by Wage/Income Gap
In terms of wage/income gap, the demographic groups most similar to Cherokee are Luxembourger (27.4%, a difference of 0.050%), Slavic (27.4%, a difference of 0.090%), Immigrants from France (27.4%, a difference of 0.10%), Israeli (27.4%, a difference of 0.11%), and Icelander (27.5%, a difference of 0.16%).
| Demographics | Rating | Rank | Wage/Income Gap |
| Carpatho Rusyns | 2.7 /100 | #249 | Tragic 27.3% |
| Immigrants | Czechoslovakia | 2.7 /100 | #250 | Tragic 27.3% |
| Immigrants | Norway | 2.5 /100 | #251 | Tragic 27.3% |
| Ukrainians | 2.4 /100 | #252 | Tragic 27.3% |
| Portuguese | 2.2 /100 | #253 | Tragic 27.4% |
| Israelis | 2.1 /100 | #254 | Tragic 27.4% |
| Immigrants | France | 2.1 /100 | #255 | Tragic 27.4% |
| Cherokee | 1.9 /100 | #256 | Tragic 27.4% |
| Luxembourgers | 1.9 /100 | #257 | Tragic 27.4% |
| Slavs | 1.8 /100 | #258 | Tragic 27.4% |
| Icelanders | 1.8 /100 | #259 | Tragic 27.5% |
| Tongans | 1.7 /100 | #260 | Tragic 27.5% |
| Immigrants | Germany | 1.5 /100 | #261 | Tragic 27.5% |
| Immigrants | Lebanon | 1.5 /100 | #262 | Tragic 27.5% |
| Syrians | 1.4 /100 | #263 | Tragic 27.6% |
Demographics Similar to Salvadorans by Wage/Income Gap
In terms of wage/income gap, the demographic groups most similar to Salvadorans are Immigrants from Nicaragua (23.0%, a difference of 0.070%), Nigerian (23.0%, a difference of 0.15%), African (22.9%, a difference of 0.26%), Ecuadorian (22.9%, a difference of 0.39%), and Fijian (22.9%, a difference of 0.41%).
| Demographics | Rating | Rank | Wage/Income Gap |
| Immigrants | Eastern Africa | 99.9 /100 | #73 | Exceptional 22.8% |
| Immigrants | Burma/Myanmar | 99.9 /100 | #74 | Exceptional 22.8% |
| Fijians | 99.9 /100 | #75 | Exceptional 22.9% |
| Ecuadorians | 99.9 /100 | #76 | Exceptional 22.9% |
| Africans | 99.9 /100 | #77 | Exceptional 22.9% |
| Nigerians | 99.9 /100 | #78 | Exceptional 23.0% |
| Immigrants | Nicaragua | 99.9 /100 | #79 | Exceptional 23.0% |
| Salvadorans | 99.9 /100 | #80 | Exceptional 23.0% |
| Bermudans | 99.8 /100 | #81 | Exceptional 23.1% |
| Central Americans | 99.8 /100 | #82 | Exceptional 23.1% |
| Immigrants | Africa | 99.8 /100 | #83 | Exceptional 23.2% |
| Cubans | 99.7 /100 | #84 | Exceptional 23.3% |
| Immigrants | Cambodia | 99.7 /100 | #85 | Exceptional 23.3% |
| Cheyenne | 99.7 /100 | #86 | Exceptional 23.3% |
| Yuman | 99.7 /100 | #87 | Exceptional 23.3% |