Cherokee vs English Wage/Income Gap
COMPARE
Cherokee
English
Wage/Income Gap
Wage/Income Gap Comparison
Cherokee
English
27.4%
WAGE/INCOME GAP
1.9/ 100
METRIC RATING
256th/ 347
METRIC RANK
29.5%
WAGE/INCOME GAP
0.0/ 100
METRIC RATING
336th/ 347
METRIC RANK
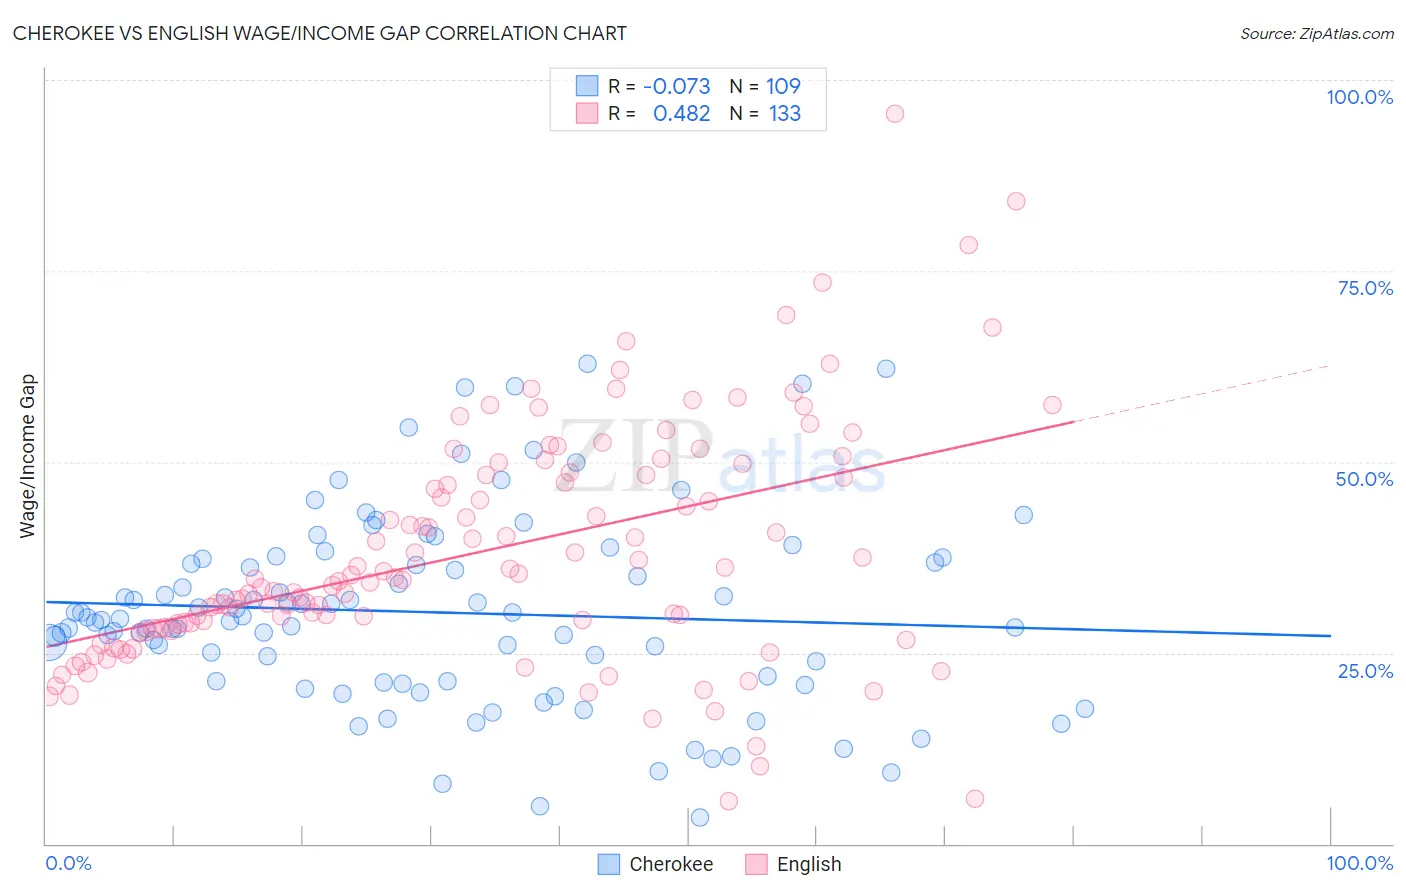
Cherokee vs English Wage/Income Gap Correlation Chart
The statistical analysis conducted on geographies consisting of 492,544,110 people shows a slight negative correlation between the proportion of Cherokee and wage/income gap percentage in the United States with a correlation coefficient (R) of -0.073 and weighted average of 27.4%. Similarly, the statistical analysis conducted on geographies consisting of 575,625,723 people shows a moderate positive correlation between the proportion of English and wage/income gap percentage in the United States with a correlation coefficient (R) of 0.482 and weighted average of 29.5%, a difference of 7.5%.
Wage/Income Gap Correlation Summary
| Measurement | Cherokee | English |
| Minimum | 3.4% | 5.6% |
| Maximum | 62.9% | 95.6% |
| Range | 59.5% | 90.1% |
| Mean | 30.3% | 38.2% |
| Median | 29.4% | 34.6% |
| Interquartile 25% (IQ1) | 21.3% | 28.2% |
| Interquartile 75% (IQ3) | 37.1% | 48.5% |
| Interquartile Range (IQR) | 15.8% | 20.3% |
| Standard Deviation (Sample) | 12.4% | 15.5% |
| Standard Deviation (Population) | 12.4% | 15.4% |
Similar Demographics by Wage/Income Gap
Demographics Similar to Cherokee by Wage/Income Gap
In terms of wage/income gap, the demographic groups most similar to Cherokee are Luxembourger (27.4%, a difference of 0.050%), Slavic (27.4%, a difference of 0.090%), Immigrants from France (27.4%, a difference of 0.10%), Israeli (27.4%, a difference of 0.11%), and Icelander (27.5%, a difference of 0.16%).
| Demographics | Rating | Rank | Wage/Income Gap |
| Carpatho Rusyns | 2.7 /100 | #249 | Tragic 27.3% |
| Immigrants | Czechoslovakia | 2.7 /100 | #250 | Tragic 27.3% |
| Immigrants | Norway | 2.5 /100 | #251 | Tragic 27.3% |
| Ukrainians | 2.4 /100 | #252 | Tragic 27.3% |
| Portuguese | 2.2 /100 | #253 | Tragic 27.4% |
| Israelis | 2.1 /100 | #254 | Tragic 27.4% |
| Immigrants | France | 2.1 /100 | #255 | Tragic 27.4% |
| Cherokee | 1.9 /100 | #256 | Tragic 27.4% |
| Luxembourgers | 1.9 /100 | #257 | Tragic 27.4% |
| Slavs | 1.8 /100 | #258 | Tragic 27.4% |
| Icelanders | 1.8 /100 | #259 | Tragic 27.5% |
| Tongans | 1.7 /100 | #260 | Tragic 27.5% |
| Immigrants | Germany | 1.5 /100 | #261 | Tragic 27.5% |
| Immigrants | Lebanon | 1.5 /100 | #262 | Tragic 27.5% |
| Syrians | 1.4 /100 | #263 | Tragic 27.6% |
Demographics Similar to English by Wage/Income Gap
In terms of wage/income gap, the demographic groups most similar to English are Immigrants from Taiwan (29.5%, a difference of 0.010%), Swedish (29.4%, a difference of 0.14%), European (29.4%, a difference of 0.28%), Immigrants from South Central Asia (29.3%, a difference of 0.47%), and Dutch (29.6%, a difference of 0.58%).
| Demographics | Rating | Rank | Wage/Income Gap |
| Scottish | 0.0 /100 | #329 | Tragic 29.1% |
| Germans | 0.0 /100 | #330 | Tragic 29.2% |
| Czechs | 0.0 /100 | #331 | Tragic 29.2% |
| Immigrants | South Central Asia | 0.0 /100 | #332 | Tragic 29.3% |
| Europeans | 0.0 /100 | #333 | Tragic 29.4% |
| Swedes | 0.0 /100 | #334 | Tragic 29.4% |
| Immigrants | Taiwan | 0.0 /100 | #335 | Tragic 29.5% |
| English | 0.0 /100 | #336 | Tragic 29.5% |
| Dutch | 0.0 /100 | #337 | Tragic 29.6% |
| Filipinos | 0.0 /100 | #338 | Tragic 29.7% |
| Iranians | 0.0 /100 | #339 | Tragic 29.7% |
| Swiss | 0.0 /100 | #340 | Tragic 30.0% |
| Thais | 0.0 /100 | #341 | Tragic 30.5% |
| Pennsylvania Germans | 0.0 /100 | #342 | Tragic 30.7% |
| Danes | 0.0 /100 | #343 | Tragic 31.0% |