Cambodian vs Immigrants from Colombia Median Male Earnings
COMPARE
Cambodian
Immigrants from Colombia
Median Male Earnings
Median Male Earnings Comparison
Cambodians
Immigrants from Colombia
$62,516
MEDIAN MALE EARNINGS
100.0/ 100
METRIC RATING
44th/ 347
METRIC RANK
$52,725
MEDIAN MALE EARNINGS
15.0/ 100
METRIC RATING
205th/ 347
METRIC RANK
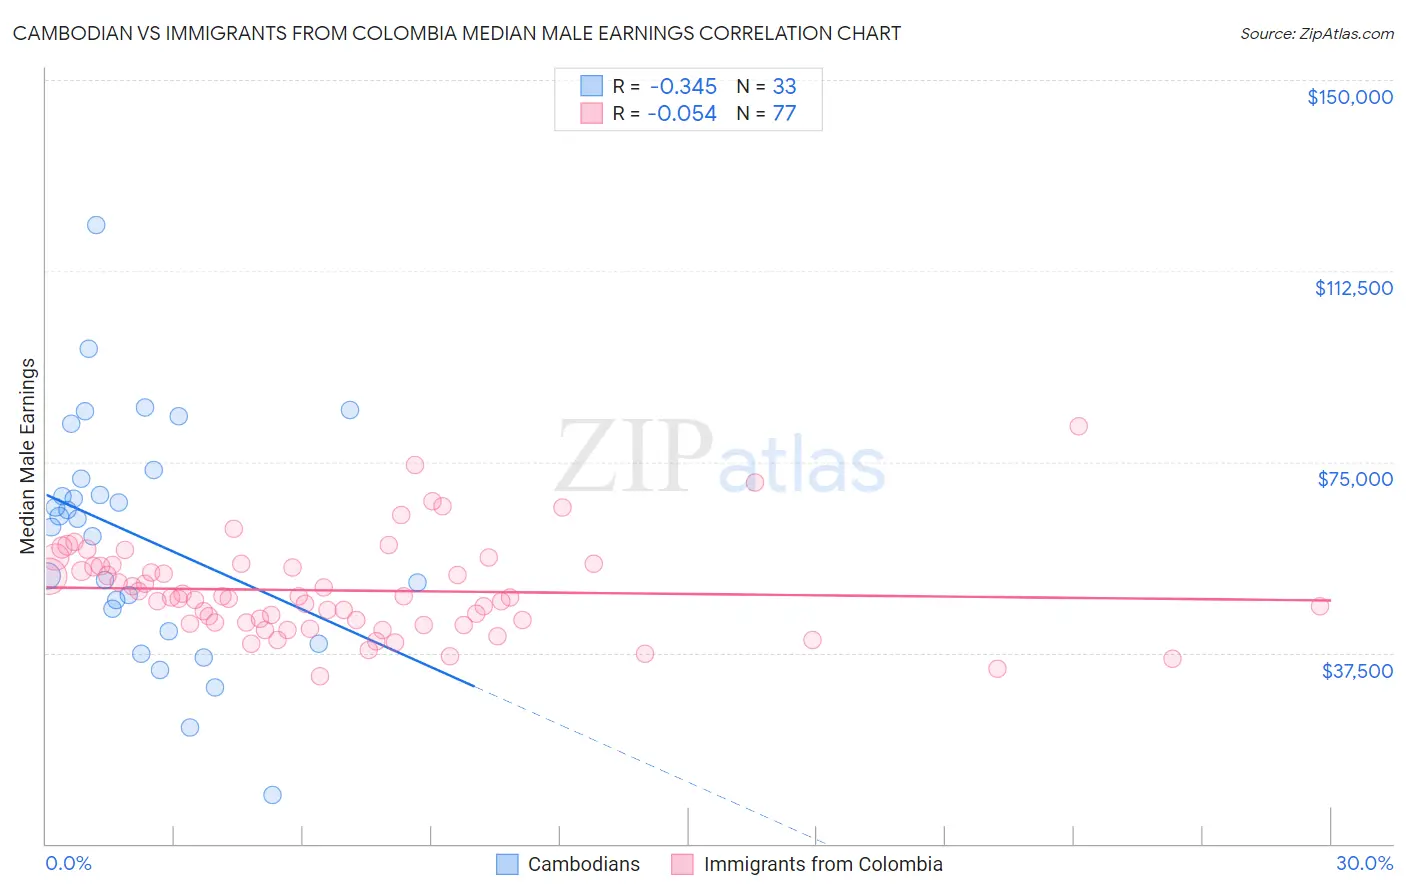
Cambodian vs Immigrants from Colombia Median Male Earnings Correlation Chart
The statistical analysis conducted on geographies consisting of 102,506,129 people shows a mild negative correlation between the proportion of Cambodians and median male earnings in the United States with a correlation coefficient (R) of -0.345 and weighted average of $62,516. Similarly, the statistical analysis conducted on geographies consisting of 378,593,479 people shows a slight negative correlation between the proportion of Immigrants from Colombia and median male earnings in the United States with a correlation coefficient (R) of -0.054 and weighted average of $52,725, a difference of 18.6%.
Median Male Earnings Correlation Summary
| Measurement | Cambodian | Immigrants from Colombia |
| Minimum | $9,467 | $32,886 |
| Maximum | $121,577 | $81,875 |
| Range | $112,110 | $48,989 |
| Mean | $60,326 | $49,733 |
| Median | $63,742 | $48,323 |
| Interquartile 25% (IQ1) | $43,962 | $43,300 |
| Interquartile 75% (IQ3) | $72,546 | $54,661 |
| Interquartile Range (IQR) | $28,584 | $11,361 |
| Standard Deviation (Sample) | $22,914 | $9,264 |
| Standard Deviation (Population) | $22,564 | $9,204 |
Similar Demographics by Median Male Earnings
Demographics Similar to Cambodians by Median Male Earnings
In terms of median male earnings, the demographic groups most similar to Cambodians are Bulgarian ($62,378, a difference of 0.22%), Immigrants from Belarus ($62,658, a difference of 0.23%), Immigrants from Greece ($62,689, a difference of 0.28%), Immigrants from Turkey ($62,728, a difference of 0.34%), and Immigrants from Czechoslovakia ($62,217, a difference of 0.48%).
| Demographics | Rating | Rank | Median Male Earnings |
| Immigrants | Sri Lanka | 100.0 /100 | #37 | Exceptional $63,099 |
| Maltese | 100.0 /100 | #38 | Exceptional $62,953 |
| Immigrants | South Africa | 100.0 /100 | #39 | Exceptional $62,899 |
| Australians | 100.0 /100 | #40 | Exceptional $62,857 |
| Immigrants | Turkey | 100.0 /100 | #41 | Exceptional $62,728 |
| Immigrants | Greece | 100.0 /100 | #42 | Exceptional $62,689 |
| Immigrants | Belarus | 100.0 /100 | #43 | Exceptional $62,658 |
| Cambodians | 100.0 /100 | #44 | Exceptional $62,516 |
| Bulgarians | 100.0 /100 | #45 | Exceptional $62,378 |
| Immigrants | Czechoslovakia | 99.9 /100 | #46 | Exceptional $62,217 |
| Immigrants | Austria | 99.9 /100 | #47 | Exceptional $62,164 |
| Immigrants | Malaysia | 99.9 /100 | #48 | Exceptional $62,121 |
| Immigrants | Europe | 99.9 /100 | #49 | Exceptional $62,057 |
| Bhutanese | 99.9 /100 | #50 | Exceptional $61,759 |
| Estonians | 99.9 /100 | #51 | Exceptional $61,710 |
Demographics Similar to Immigrants from Colombia by Median Male Earnings
In terms of median male earnings, the demographic groups most similar to Immigrants from Colombia are Immigrants from Iraq ($52,681, a difference of 0.080%), Ghanaian ($52,810, a difference of 0.16%), Panamanian ($52,835, a difference of 0.21%), Immigrants from Uruguay ($52,860, a difference of 0.26%), and Immigrants from Bosnia and Herzegovina ($52,869, a difference of 0.27%).
| Demographics | Rating | Rank | Median Male Earnings |
| Immigrants | Costa Rica | 22.6 /100 | #198 | Fair $53,237 |
| Tongans | 22.3 /100 | #199 | Fair $53,218 |
| Immigrants | Thailand | 17.5 /100 | #200 | Poor $52,908 |
| Immigrants | Bosnia and Herzegovina | 16.9 /100 | #201 | Poor $52,869 |
| Immigrants | Uruguay | 16.8 /100 | #202 | Poor $52,860 |
| Panamanians | 16.5 /100 | #203 | Poor $52,835 |
| Ghanaians | 16.1 /100 | #204 | Poor $52,810 |
| Immigrants | Colombia | 15.0 /100 | #205 | Poor $52,725 |
| Immigrants | Iraq | 14.5 /100 | #206 | Poor $52,681 |
| Vietnamese | 12.7 /100 | #207 | Poor $52,525 |
| Venezuelans | 12.5 /100 | #208 | Poor $52,510 |
| Bermudans | 12.1 /100 | #209 | Poor $52,465 |
| Delaware | 11.5 /100 | #210 | Poor $52,412 |
| Tlingit-Haida | 11.5 /100 | #211 | Poor $52,409 |
| Cajuns | 10.7 /100 | #212 | Poor $52,325 |