Cambodian vs Australian Median Male Earnings
COMPARE
Cambodian
Australian
Median Male Earnings
Median Male Earnings Comparison
Cambodians
Australians
$62,516
MEDIAN MALE EARNINGS
100.0/ 100
METRIC RATING
44th/ 347
METRIC RANK
$62,857
MEDIAN MALE EARNINGS
100.0/ 100
METRIC RATING
40th/ 347
METRIC RANK
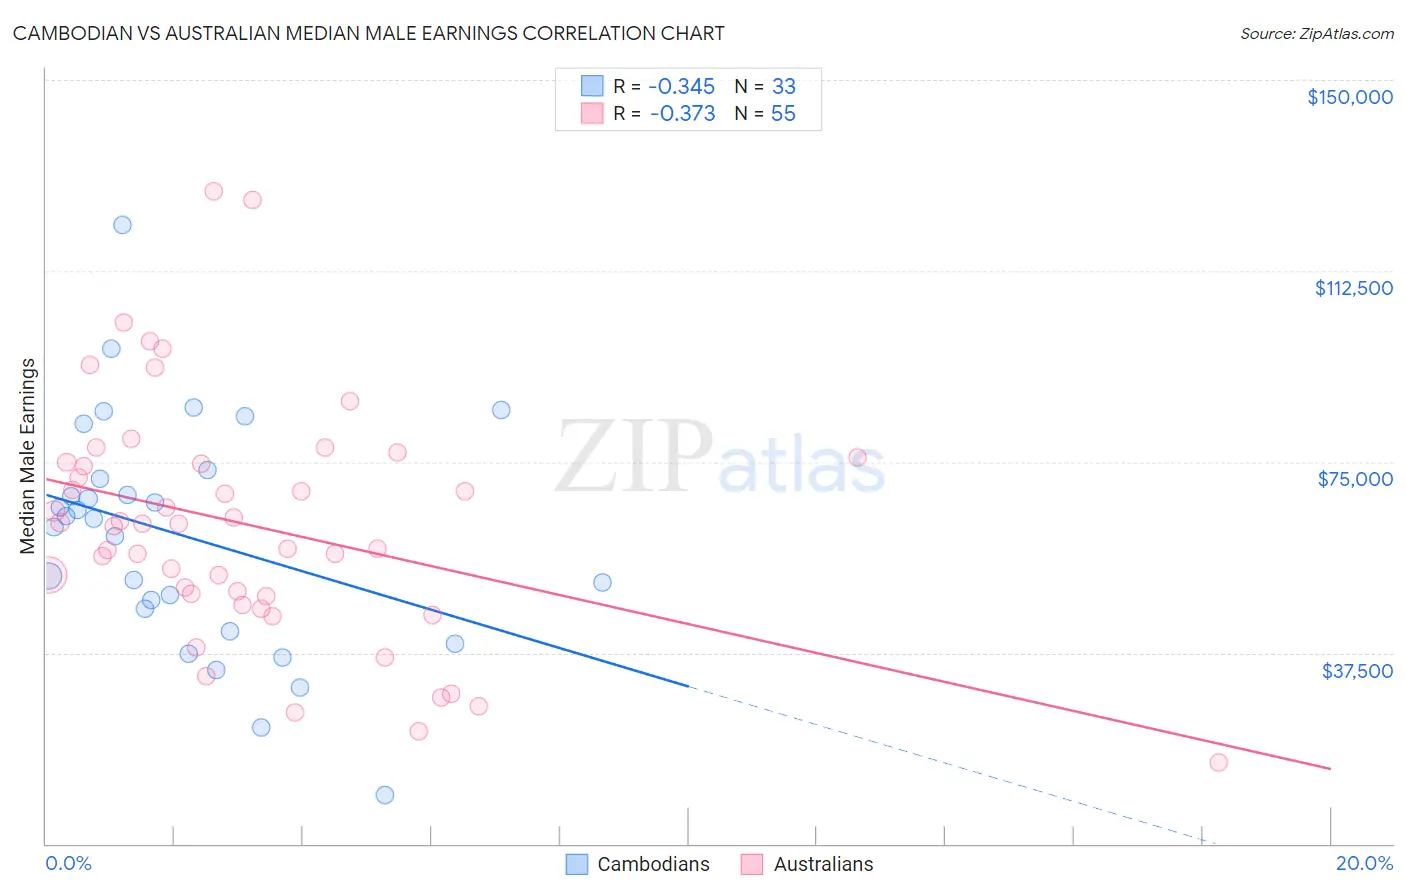
Cambodian vs Australian Median Male Earnings Correlation Chart
The statistical analysis conducted on geographies consisting of 102,506,129 people shows a mild negative correlation between the proportion of Cambodians and median male earnings in the United States with a correlation coefficient (R) of -0.345 and weighted average of $62,516. Similarly, the statistical analysis conducted on geographies consisting of 224,135,609 people shows a mild negative correlation between the proportion of Australians and median male earnings in the United States with a correlation coefficient (R) of -0.373 and weighted average of $62,857, a difference of 0.55%.
Median Male Earnings Correlation Summary
| Measurement | Cambodian | Australian |
| Minimum | $9,467 | $15,945 |
| Maximum | $121,577 | $128,097 |
| Range | $112,110 | $112,152 |
| Mean | $60,326 | $62,501 |
| Median | $63,742 | $62,813 |
| Interquartile 25% (IQ1) | $43,962 | $48,594 |
| Interquartile 75% (IQ3) | $72,546 | $74,900 |
| Interquartile Range (IQR) | $28,584 | $26,306 |
| Standard Deviation (Sample) | $22,914 | $23,536 |
| Standard Deviation (Population) | $22,564 | $23,321 |
Demographics Similar to Cambodians and Australians by Median Male Earnings
In terms of median male earnings, the demographic groups most similar to Cambodians are Bulgarian ($62,378, a difference of 0.22%), Immigrants from Belarus ($62,658, a difference of 0.23%), Immigrants from Greece ($62,689, a difference of 0.28%), Immigrants from Turkey ($62,728, a difference of 0.34%), and Immigrants from Czechoslovakia ($62,217, a difference of 0.48%). Similarly, the demographic groups most similar to Australians are Immigrants from South Africa ($62,899, a difference of 0.070%), Maltese ($62,953, a difference of 0.15%), Immigrants from Turkey ($62,728, a difference of 0.21%), Immigrants from Greece ($62,689, a difference of 0.27%), and Immigrants from Belarus ($62,658, a difference of 0.32%).
| Demographics | Rating | Rank | Median Male Earnings |
| Soviet Union | 100.0 /100 | #32 | Exceptional $63,382 |
| Immigrants | Lithuania | 100.0 /100 | #33 | Exceptional $63,346 |
| Immigrants | Russia | 100.0 /100 | #34 | Exceptional $63,326 |
| Immigrants | Asia | 100.0 /100 | #35 | Exceptional $63,240 |
| Israelis | 100.0 /100 | #36 | Exceptional $63,228 |
| Immigrants | Sri Lanka | 100.0 /100 | #37 | Exceptional $63,099 |
| Maltese | 100.0 /100 | #38 | Exceptional $62,953 |
| Immigrants | South Africa | 100.0 /100 | #39 | Exceptional $62,899 |
| Australians | 100.0 /100 | #40 | Exceptional $62,857 |
| Immigrants | Turkey | 100.0 /100 | #41 | Exceptional $62,728 |
| Immigrants | Greece | 100.0 /100 | #42 | Exceptional $62,689 |
| Immigrants | Belarus | 100.0 /100 | #43 | Exceptional $62,658 |
| Cambodians | 100.0 /100 | #44 | Exceptional $62,516 |
| Bulgarians | 100.0 /100 | #45 | Exceptional $62,378 |
| Immigrants | Czechoslovakia | 99.9 /100 | #46 | Exceptional $62,217 |
| Immigrants | Austria | 99.9 /100 | #47 | Exceptional $62,164 |
| Immigrants | Malaysia | 99.9 /100 | #48 | Exceptional $62,121 |
| Immigrants | Europe | 99.9 /100 | #49 | Exceptional $62,057 |
| Bhutanese | 99.9 /100 | #50 | Exceptional $61,759 |
| Estonians | 99.9 /100 | #51 | Exceptional $61,710 |
| Immigrants | Norway | 99.9 /100 | #52 | Exceptional $61,628 |