Cambodian vs Dominican Median Male Earnings
COMPARE
Cambodian
Dominican
Median Male Earnings
Median Male Earnings Comparison
Cambodians
Dominicans
$62,516
MEDIAN MALE EARNINGS
100.0/ 100
METRIC RATING
44th/ 347
METRIC RANK
$47,204
MEDIAN MALE EARNINGS
0.1/ 100
METRIC RATING
297th/ 347
METRIC RANK
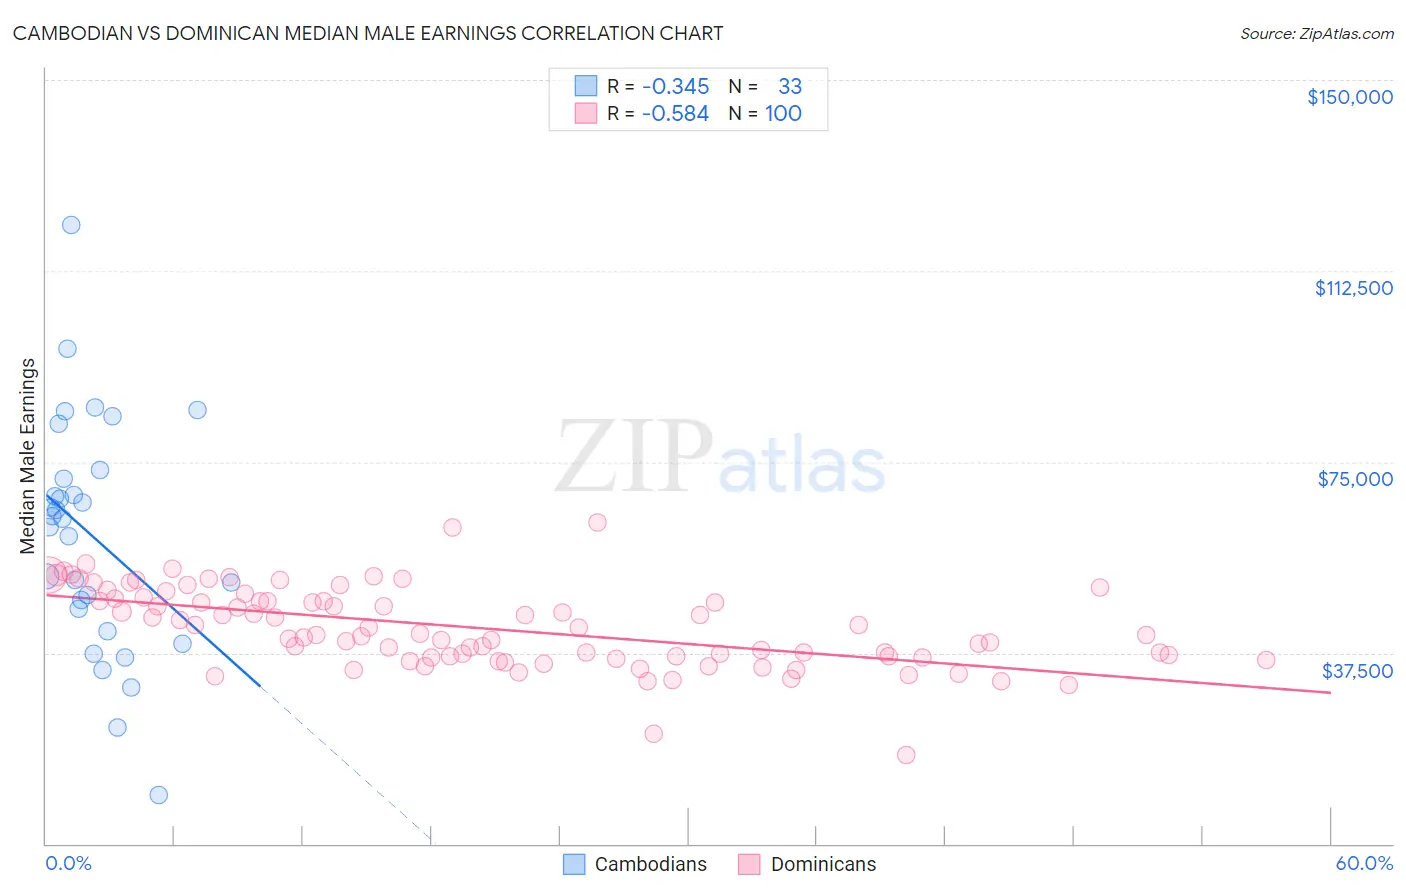
Cambodian vs Dominican Median Male Earnings Correlation Chart
The statistical analysis conducted on geographies consisting of 102,506,129 people shows a mild negative correlation between the proportion of Cambodians and median male earnings in the United States with a correlation coefficient (R) of -0.345 and weighted average of $62,516. Similarly, the statistical analysis conducted on geographies consisting of 355,000,212 people shows a substantial negative correlation between the proportion of Dominicans and median male earnings in the United States with a correlation coefficient (R) of -0.584 and weighted average of $47,204, a difference of 32.4%.
Median Male Earnings Correlation Summary
| Measurement | Cambodian | Dominican |
| Minimum | $9,467 | $17,436 |
| Maximum | $121,577 | $62,989 |
| Range | $112,110 | $45,553 |
| Mean | $60,326 | $42,393 |
| Median | $63,742 | $41,223 |
| Interquartile 25% (IQ1) | $43,962 | $36,717 |
| Interquartile 75% (IQ3) | $72,546 | $47,976 |
| Interquartile Range (IQR) | $28,584 | $11,259 |
| Standard Deviation (Sample) | $22,914 | $7,882 |
| Standard Deviation (Population) | $22,564 | $7,843 |
Similar Demographics by Median Male Earnings
Demographics Similar to Cambodians by Median Male Earnings
In terms of median male earnings, the demographic groups most similar to Cambodians are Bulgarian ($62,378, a difference of 0.22%), Immigrants from Belarus ($62,658, a difference of 0.23%), Immigrants from Greece ($62,689, a difference of 0.28%), Immigrants from Turkey ($62,728, a difference of 0.34%), and Immigrants from Czechoslovakia ($62,217, a difference of 0.48%).
| Demographics | Rating | Rank | Median Male Earnings |
| Immigrants | Sri Lanka | 100.0 /100 | #37 | Exceptional $63,099 |
| Maltese | 100.0 /100 | #38 | Exceptional $62,953 |
| Immigrants | South Africa | 100.0 /100 | #39 | Exceptional $62,899 |
| Australians | 100.0 /100 | #40 | Exceptional $62,857 |
| Immigrants | Turkey | 100.0 /100 | #41 | Exceptional $62,728 |
| Immigrants | Greece | 100.0 /100 | #42 | Exceptional $62,689 |
| Immigrants | Belarus | 100.0 /100 | #43 | Exceptional $62,658 |
| Cambodians | 100.0 /100 | #44 | Exceptional $62,516 |
| Bulgarians | 100.0 /100 | #45 | Exceptional $62,378 |
| Immigrants | Czechoslovakia | 99.9 /100 | #46 | Exceptional $62,217 |
| Immigrants | Austria | 99.9 /100 | #47 | Exceptional $62,164 |
| Immigrants | Malaysia | 99.9 /100 | #48 | Exceptional $62,121 |
| Immigrants | Europe | 99.9 /100 | #49 | Exceptional $62,057 |
| Bhutanese | 99.9 /100 | #50 | Exceptional $61,759 |
| Estonians | 99.9 /100 | #51 | Exceptional $61,710 |
Demographics Similar to Dominicans by Median Male Earnings
In terms of median male earnings, the demographic groups most similar to Dominicans are Immigrants from Micronesia ($47,177, a difference of 0.060%), Inupiat ($47,281, a difference of 0.16%), Immigrants from Zaire ($47,070, a difference of 0.28%), U.S. Virgin Islander ($47,066, a difference of 0.29%), and Central American Indian ($47,433, a difference of 0.48%).
| Demographics | Rating | Rank | Median Male Earnings |
| Immigrants | Belize | 0.1 /100 | #290 | Tragic $47,809 |
| Choctaw | 0.1 /100 | #291 | Tragic $47,729 |
| Immigrants | Dominica | 0.1 /100 | #292 | Tragic $47,651 |
| Indonesians | 0.1 /100 | #293 | Tragic $47,503 |
| Immigrants | Nicaragua | 0.1 /100 | #294 | Tragic $47,482 |
| Central American Indians | 0.1 /100 | #295 | Tragic $47,433 |
| Inupiat | 0.1 /100 | #296 | Tragic $47,281 |
| Dominicans | 0.1 /100 | #297 | Tragic $47,204 |
| Immigrants | Micronesia | 0.1 /100 | #298 | Tragic $47,177 |
| Immigrants | Zaire | 0.1 /100 | #299 | Tragic $47,070 |
| U.S. Virgin Islanders | 0.1 /100 | #300 | Tragic $47,066 |
| Immigrants | Latin America | 0.1 /100 | #301 | Tragic $46,941 |
| Seminole | 0.1 /100 | #302 | Tragic $46,783 |
| Yaqui | 0.1 /100 | #303 | Tragic $46,777 |
| Bangladeshis | 0.1 /100 | #304 | Tragic $46,744 |