Cambodian vs Immigrants from Korea Median Male Earnings
COMPARE
Cambodian
Immigrants from Korea
Median Male Earnings
Median Male Earnings Comparison
Cambodians
Immigrants from Korea
$62,516
MEDIAN MALE EARNINGS
100.0/ 100
METRIC RATING
44th/ 347
METRIC RANK
$65,079
MEDIAN MALE EARNINGS
100.0/ 100
METRIC RATING
23rd/ 347
METRIC RANK
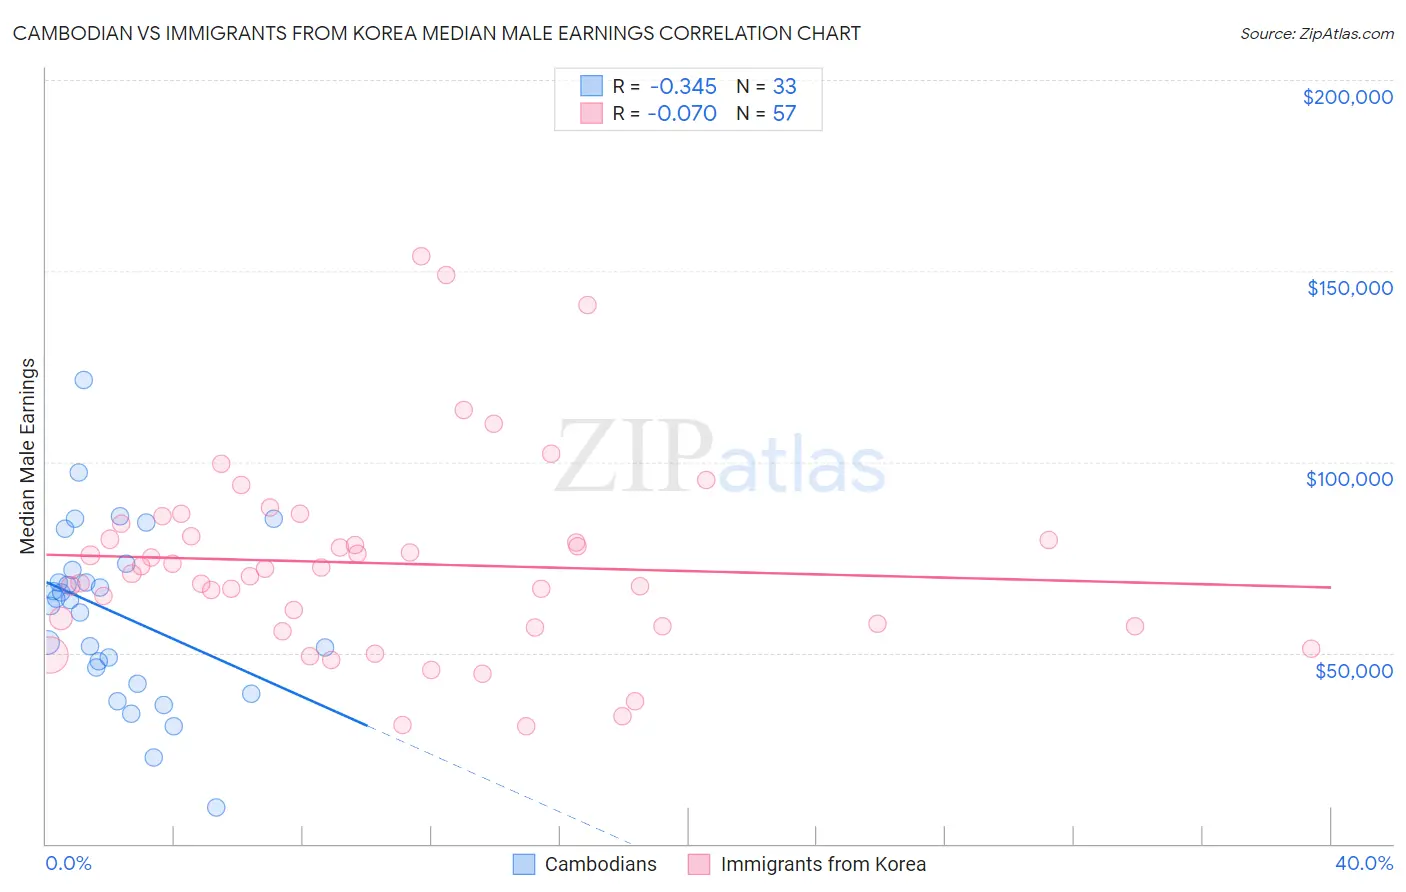
Cambodian vs Immigrants from Korea Median Male Earnings Correlation Chart
The statistical analysis conducted on geographies consisting of 102,506,129 people shows a mild negative correlation between the proportion of Cambodians and median male earnings in the United States with a correlation coefficient (R) of -0.345 and weighted average of $62,516. Similarly, the statistical analysis conducted on geographies consisting of 416,203,155 people shows a slight negative correlation between the proportion of Immigrants from Korea and median male earnings in the United States with a correlation coefficient (R) of -0.070 and weighted average of $65,079, a difference of 4.1%.
Median Male Earnings Correlation Summary
| Measurement | Cambodian | Immigrants from Korea |
| Minimum | $9,467 | $30,795 |
| Maximum | $121,577 | $153,870 |
| Range | $112,110 | $123,075 |
| Mean | $60,326 | $73,429 |
| Median | $63,742 | $71,921 |
| Interquartile 25% (IQ1) | $43,962 | $56,978 |
| Interquartile 75% (IQ3) | $72,546 | $82,188 |
| Interquartile Range (IQR) | $28,584 | $25,211 |
| Standard Deviation (Sample) | $22,914 | $25,444 |
| Standard Deviation (Population) | $22,564 | $25,220 |
Similar Demographics by Median Male Earnings
Demographics Similar to Cambodians by Median Male Earnings
In terms of median male earnings, the demographic groups most similar to Cambodians are Bulgarian ($62,378, a difference of 0.22%), Immigrants from Belarus ($62,658, a difference of 0.23%), Immigrants from Greece ($62,689, a difference of 0.28%), Immigrants from Turkey ($62,728, a difference of 0.34%), and Immigrants from Czechoslovakia ($62,217, a difference of 0.48%).
| Demographics | Rating | Rank | Median Male Earnings |
| Immigrants | Sri Lanka | 100.0 /100 | #37 | Exceptional $63,099 |
| Maltese | 100.0 /100 | #38 | Exceptional $62,953 |
| Immigrants | South Africa | 100.0 /100 | #39 | Exceptional $62,899 |
| Australians | 100.0 /100 | #40 | Exceptional $62,857 |
| Immigrants | Turkey | 100.0 /100 | #41 | Exceptional $62,728 |
| Immigrants | Greece | 100.0 /100 | #42 | Exceptional $62,689 |
| Immigrants | Belarus | 100.0 /100 | #43 | Exceptional $62,658 |
| Cambodians | 100.0 /100 | #44 | Exceptional $62,516 |
| Bulgarians | 100.0 /100 | #45 | Exceptional $62,378 |
| Immigrants | Czechoslovakia | 99.9 /100 | #46 | Exceptional $62,217 |
| Immigrants | Austria | 99.9 /100 | #47 | Exceptional $62,164 |
| Immigrants | Malaysia | 99.9 /100 | #48 | Exceptional $62,121 |
| Immigrants | Europe | 99.9 /100 | #49 | Exceptional $62,057 |
| Bhutanese | 99.9 /100 | #50 | Exceptional $61,759 |
| Estonians | 99.9 /100 | #51 | Exceptional $61,710 |
Demographics Similar to Immigrants from Korea by Median Male Earnings
In terms of median male earnings, the demographic groups most similar to Immigrants from Korea are Immigrants from Northern Europe ($64,987, a difference of 0.14%), Burmese ($65,236, a difference of 0.24%), Immigrants from Sweden ($65,406, a difference of 0.50%), Immigrants from Japan ($65,518, a difference of 0.67%), and Immigrants from Denmark ($64,625, a difference of 0.70%).
| Demographics | Rating | Rank | Median Male Earnings |
| Eastern Europeans | 100.0 /100 | #16 | Exceptional $66,472 |
| Immigrants | Belgium | 100.0 /100 | #17 | Exceptional $66,125 |
| Indians (Asian) | 100.0 /100 | #18 | Exceptional $66,078 |
| Cypriots | 100.0 /100 | #19 | Exceptional $65,549 |
| Immigrants | Japan | 100.0 /100 | #20 | Exceptional $65,518 |
| Immigrants | Sweden | 100.0 /100 | #21 | Exceptional $65,406 |
| Burmese | 100.0 /100 | #22 | Exceptional $65,236 |
| Immigrants | Korea | 100.0 /100 | #23 | Exceptional $65,079 |
| Immigrants | Northern Europe | 100.0 /100 | #24 | Exceptional $64,987 |
| Immigrants | Denmark | 100.0 /100 | #25 | Exceptional $64,625 |
| Turks | 100.0 /100 | #26 | Exceptional $64,253 |
| Immigrants | Switzerland | 100.0 /100 | #27 | Exceptional $63,944 |
| Russians | 100.0 /100 | #28 | Exceptional $63,939 |
| Asians | 100.0 /100 | #29 | Exceptional $63,827 |
| Immigrants | France | 100.0 /100 | #30 | Exceptional $63,715 |