Cambodian vs Eastern European Median Male Earnings
COMPARE
Cambodian
Eastern European
Median Male Earnings
Median Male Earnings Comparison
Cambodians
Eastern Europeans
$62,516
MEDIAN MALE EARNINGS
100.0/ 100
METRIC RATING
44th/ 347
METRIC RANK
$66,472
MEDIAN MALE EARNINGS
100.0/ 100
METRIC RATING
16th/ 347
METRIC RANK
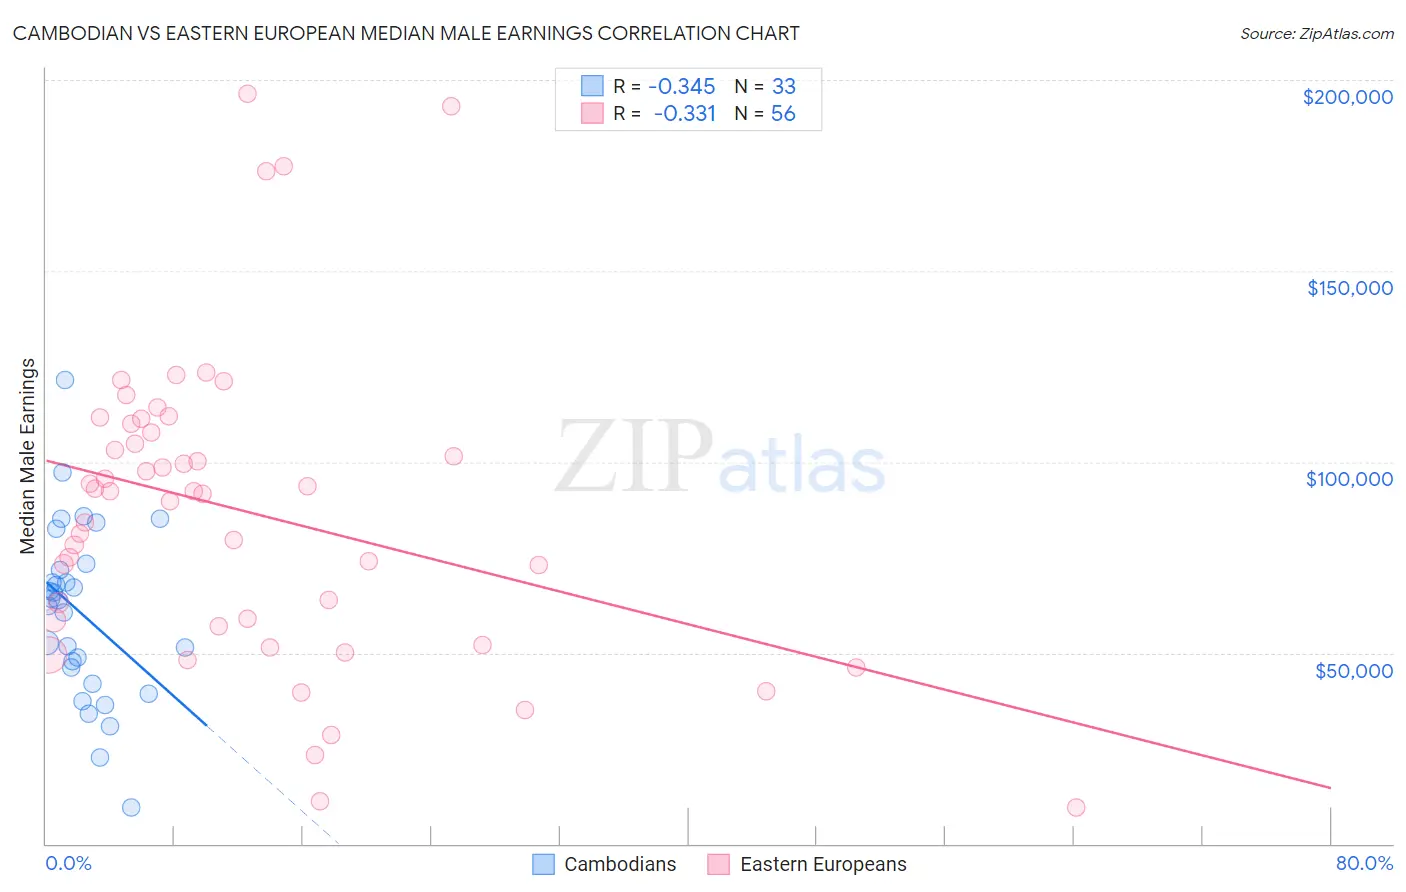
Cambodian vs Eastern European Median Male Earnings Correlation Chart
The statistical analysis conducted on geographies consisting of 102,506,129 people shows a mild negative correlation between the proportion of Cambodians and median male earnings in the United States with a correlation coefficient (R) of -0.345 and weighted average of $62,516. Similarly, the statistical analysis conducted on geographies consisting of 460,960,346 people shows a mild negative correlation between the proportion of Eastern Europeans and median male earnings in the United States with a correlation coefficient (R) of -0.331 and weighted average of $66,472, a difference of 6.3%.
Median Male Earnings Correlation Summary
| Measurement | Cambodian | Eastern European |
| Minimum | $9,467 | $9,364 |
| Maximum | $121,577 | $196,250 |
| Range | $112,110 | $186,886 |
| Mean | $60,326 | $86,901 |
| Median | $63,742 | $91,970 |
| Interquartile 25% (IQ1) | $43,962 | $57,711 |
| Interquartile 75% (IQ3) | $72,546 | $108,812 |
| Interquartile Range (IQR) | $28,584 | $51,101 |
| Standard Deviation (Sample) | $22,914 | $40,387 |
| Standard Deviation (Population) | $22,564 | $40,024 |
Similar Demographics by Median Male Earnings
Demographics Similar to Cambodians by Median Male Earnings
In terms of median male earnings, the demographic groups most similar to Cambodians are Bulgarian ($62,378, a difference of 0.22%), Immigrants from Belarus ($62,658, a difference of 0.23%), Immigrants from Greece ($62,689, a difference of 0.28%), Immigrants from Turkey ($62,728, a difference of 0.34%), and Immigrants from Czechoslovakia ($62,217, a difference of 0.48%).
| Demographics | Rating | Rank | Median Male Earnings |
| Immigrants | Sri Lanka | 100.0 /100 | #37 | Exceptional $63,099 |
| Maltese | 100.0 /100 | #38 | Exceptional $62,953 |
| Immigrants | South Africa | 100.0 /100 | #39 | Exceptional $62,899 |
| Australians | 100.0 /100 | #40 | Exceptional $62,857 |
| Immigrants | Turkey | 100.0 /100 | #41 | Exceptional $62,728 |
| Immigrants | Greece | 100.0 /100 | #42 | Exceptional $62,689 |
| Immigrants | Belarus | 100.0 /100 | #43 | Exceptional $62,658 |
| Cambodians | 100.0 /100 | #44 | Exceptional $62,516 |
| Bulgarians | 100.0 /100 | #45 | Exceptional $62,378 |
| Immigrants | Czechoslovakia | 99.9 /100 | #46 | Exceptional $62,217 |
| Immigrants | Austria | 99.9 /100 | #47 | Exceptional $62,164 |
| Immigrants | Malaysia | 99.9 /100 | #48 | Exceptional $62,121 |
| Immigrants | Europe | 99.9 /100 | #49 | Exceptional $62,057 |
| Bhutanese | 99.9 /100 | #50 | Exceptional $61,759 |
| Estonians | 99.9 /100 | #51 | Exceptional $61,710 |
Demographics Similar to Eastern Europeans by Median Male Earnings
In terms of median male earnings, the demographic groups most similar to Eastern Europeans are Immigrants from Belgium ($66,125, a difference of 0.53%), Indian (Asian) ($66,078, a difference of 0.60%), Immigrants from Eastern Asia ($66,903, a difference of 0.65%), Okinawan ($67,232, a difference of 1.1%), and Immigrants from China ($67,353, a difference of 1.3%).
| Demographics | Rating | Rank | Median Male Earnings |
| Immigrants | South Central Asia | 100.0 /100 | #9 | Exceptional $68,960 |
| Immigrants | Israel | 100.0 /100 | #10 | Exceptional $68,716 |
| Immigrants | Ireland | 100.0 /100 | #11 | Exceptional $67,698 |
| Immigrants | Australia | 100.0 /100 | #12 | Exceptional $67,634 |
| Immigrants | China | 100.0 /100 | #13 | Exceptional $67,353 |
| Okinawans | 100.0 /100 | #14 | Exceptional $67,232 |
| Immigrants | Eastern Asia | 100.0 /100 | #15 | Exceptional $66,903 |
| Eastern Europeans | 100.0 /100 | #16 | Exceptional $66,472 |
| Immigrants | Belgium | 100.0 /100 | #17 | Exceptional $66,125 |
| Indians (Asian) | 100.0 /100 | #18 | Exceptional $66,078 |
| Cypriots | 100.0 /100 | #19 | Exceptional $65,549 |
| Immigrants | Japan | 100.0 /100 | #20 | Exceptional $65,518 |
| Immigrants | Sweden | 100.0 /100 | #21 | Exceptional $65,406 |
| Burmese | 100.0 /100 | #22 | Exceptional $65,236 |
| Immigrants | Korea | 100.0 /100 | #23 | Exceptional $65,079 |