Cambodian vs Immigrants from Argentina Median Male Earnings
COMPARE
Cambodian
Immigrants from Argentina
Median Male Earnings
Median Male Earnings Comparison
Cambodians
Immigrants from Argentina
$62,516
MEDIAN MALE EARNINGS
100.0/ 100
METRIC RATING
44th/ 347
METRIC RANK
$59,491
MEDIAN MALE EARNINGS
99.3/ 100
METRIC RATING
88th/ 347
METRIC RANK
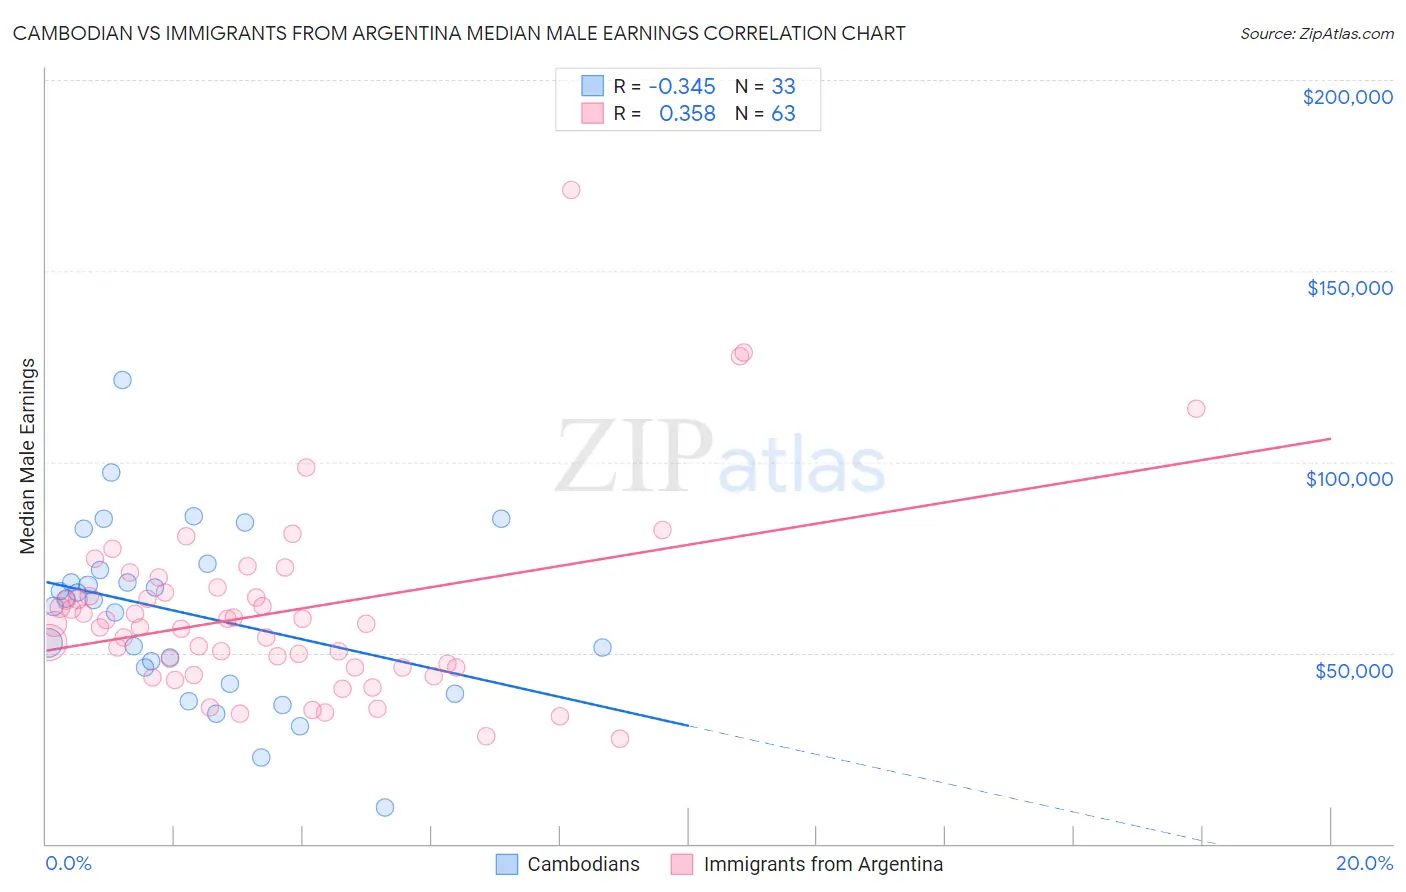
Cambodian vs Immigrants from Argentina Median Male Earnings Correlation Chart
The statistical analysis conducted on geographies consisting of 102,506,129 people shows a mild negative correlation between the proportion of Cambodians and median male earnings in the United States with a correlation coefficient (R) of -0.345 and weighted average of $62,516. Similarly, the statistical analysis conducted on geographies consisting of 264,393,462 people shows a mild positive correlation between the proportion of Immigrants from Argentina and median male earnings in the United States with a correlation coefficient (R) of 0.358 and weighted average of $59,491, a difference of 5.1%.
Median Male Earnings Correlation Summary
| Measurement | Cambodian | Immigrants from Argentina |
| Minimum | $9,467 | $27,639 |
| Maximum | $121,577 | $171,304 |
| Range | $112,110 | $143,665 |
| Mean | $60,326 | $60,629 |
| Median | $63,742 | $57,556 |
| Interquartile 25% (IQ1) | $43,962 | $46,111 |
| Interquartile 75% (IQ3) | $72,546 | $65,873 |
| Interquartile Range (IQR) | $28,584 | $19,762 |
| Standard Deviation (Sample) | $22,914 | $24,754 |
| Standard Deviation (Population) | $22,564 | $24,557 |
Similar Demographics by Median Male Earnings
Demographics Similar to Cambodians by Median Male Earnings
In terms of median male earnings, the demographic groups most similar to Cambodians are Bulgarian ($62,378, a difference of 0.22%), Immigrants from Belarus ($62,658, a difference of 0.23%), Immigrants from Greece ($62,689, a difference of 0.28%), Immigrants from Turkey ($62,728, a difference of 0.34%), and Immigrants from Czechoslovakia ($62,217, a difference of 0.48%).
| Demographics | Rating | Rank | Median Male Earnings |
| Immigrants | Sri Lanka | 100.0 /100 | #37 | Exceptional $63,099 |
| Maltese | 100.0 /100 | #38 | Exceptional $62,953 |
| Immigrants | South Africa | 100.0 /100 | #39 | Exceptional $62,899 |
| Australians | 100.0 /100 | #40 | Exceptional $62,857 |
| Immigrants | Turkey | 100.0 /100 | #41 | Exceptional $62,728 |
| Immigrants | Greece | 100.0 /100 | #42 | Exceptional $62,689 |
| Immigrants | Belarus | 100.0 /100 | #43 | Exceptional $62,658 |
| Cambodians | 100.0 /100 | #44 | Exceptional $62,516 |
| Bulgarians | 100.0 /100 | #45 | Exceptional $62,378 |
| Immigrants | Czechoslovakia | 99.9 /100 | #46 | Exceptional $62,217 |
| Immigrants | Austria | 99.9 /100 | #47 | Exceptional $62,164 |
| Immigrants | Malaysia | 99.9 /100 | #48 | Exceptional $62,121 |
| Immigrants | Europe | 99.9 /100 | #49 | Exceptional $62,057 |
| Bhutanese | 99.9 /100 | #50 | Exceptional $61,759 |
| Estonians | 99.9 /100 | #51 | Exceptional $61,710 |
Demographics Similar to Immigrants from Argentina by Median Male Earnings
In terms of median male earnings, the demographic groups most similar to Immigrants from Argentina are Macedonian ($59,522, a difference of 0.050%), Immigrants from England ($59,527, a difference of 0.060%), Italian ($59,551, a difference of 0.10%), Afghan ($59,554, a difference of 0.11%), and Immigrants from Moldova ($59,417, a difference of 0.12%).
| Demographics | Rating | Rank | Median Male Earnings |
| Ukrainians | 99.4 /100 | #81 | Exceptional $59,728 |
| Croatians | 99.4 /100 | #82 | Exceptional $59,715 |
| Immigrants | Italy | 99.4 /100 | #83 | Exceptional $59,691 |
| Afghans | 99.3 /100 | #84 | Exceptional $59,554 |
| Italians | 99.3 /100 | #85 | Exceptional $59,551 |
| Immigrants | England | 99.3 /100 | #86 | Exceptional $59,527 |
| Macedonians | 99.3 /100 | #87 | Exceptional $59,522 |
| Immigrants | Argentina | 99.3 /100 | #88 | Exceptional $59,491 |
| Immigrants | Moldova | 99.2 /100 | #89 | Exceptional $59,417 |
| Austrians | 99.2 /100 | #90 | Exceptional $59,359 |
| Laotians | 99.2 /100 | #91 | Exceptional $59,351 |
| Immigrants | Kazakhstan | 99.1 /100 | #92 | Exceptional $59,278 |
| Immigrants | Southern Europe | 99.0 /100 | #93 | Exceptional $59,217 |
| Immigrants | North Macedonia | 99.0 /100 | #94 | Exceptional $59,189 |
| Immigrants | Lebanon | 98.6 /100 | #95 | Exceptional $58,835 |