Cambodian vs Immigrants from Portugal Median Male Earnings
COMPARE
Cambodian
Immigrants from Portugal
Median Male Earnings
Median Male Earnings Comparison
Cambodians
Immigrants from Portugal
$62,516
MEDIAN MALE EARNINGS
100.0/ 100
METRIC RATING
44th/ 347
METRIC RANK
$55,182
MEDIAN MALE EARNINGS
66.3/ 100
METRIC RATING
165th/ 347
METRIC RANK
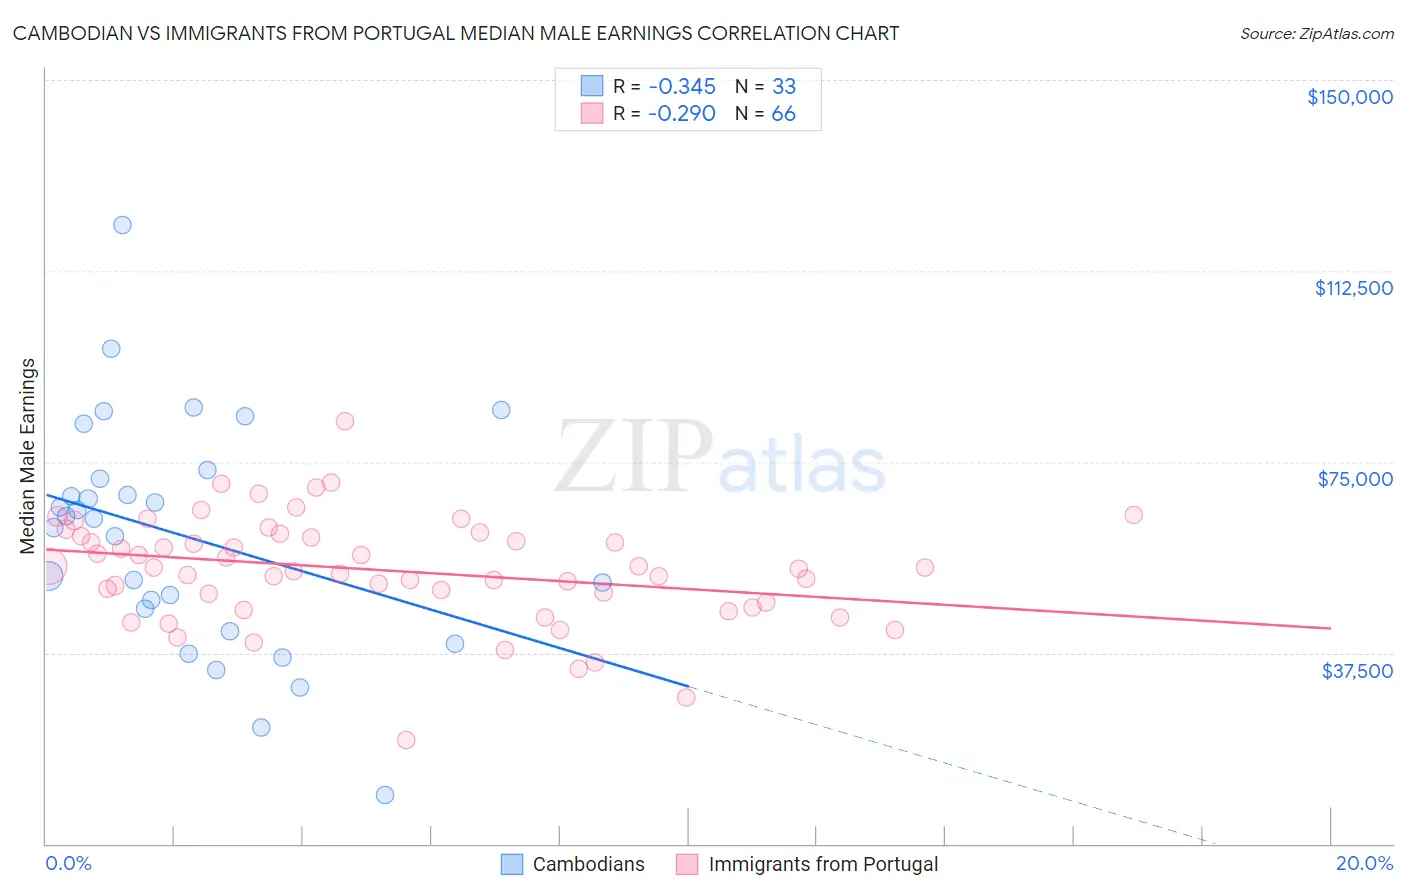
Cambodian vs Immigrants from Portugal Median Male Earnings Correlation Chart
The statistical analysis conducted on geographies consisting of 102,506,129 people shows a mild negative correlation between the proportion of Cambodians and median male earnings in the United States with a correlation coefficient (R) of -0.345 and weighted average of $62,516. Similarly, the statistical analysis conducted on geographies consisting of 174,772,823 people shows a weak negative correlation between the proportion of Immigrants from Portugal and median male earnings in the United States with a correlation coefficient (R) of -0.290 and weighted average of $55,182, a difference of 13.3%.
Median Male Earnings Correlation Summary
| Measurement | Cambodian | Immigrants from Portugal |
| Minimum | $9,467 | $20,417 |
| Maximum | $121,577 | $82,976 |
| Range | $112,110 | $62,559 |
| Mean | $60,326 | $53,702 |
| Median | $63,742 | $54,126 |
| Interquartile 25% (IQ1) | $43,962 | $47,334 |
| Interquartile 75% (IQ3) | $72,546 | $60,481 |
| Interquartile Range (IQR) | $28,584 | $13,147 |
| Standard Deviation (Sample) | $22,914 | $10,627 |
| Standard Deviation (Population) | $22,564 | $10,546 |
Similar Demographics by Median Male Earnings
Demographics Similar to Cambodians by Median Male Earnings
In terms of median male earnings, the demographic groups most similar to Cambodians are Bulgarian ($62,378, a difference of 0.22%), Immigrants from Belarus ($62,658, a difference of 0.23%), Immigrants from Greece ($62,689, a difference of 0.28%), Immigrants from Turkey ($62,728, a difference of 0.34%), and Immigrants from Czechoslovakia ($62,217, a difference of 0.48%).
| Demographics | Rating | Rank | Median Male Earnings |
| Immigrants | Sri Lanka | 100.0 /100 | #37 | Exceptional $63,099 |
| Maltese | 100.0 /100 | #38 | Exceptional $62,953 |
| Immigrants | South Africa | 100.0 /100 | #39 | Exceptional $62,899 |
| Australians | 100.0 /100 | #40 | Exceptional $62,857 |
| Immigrants | Turkey | 100.0 /100 | #41 | Exceptional $62,728 |
| Immigrants | Greece | 100.0 /100 | #42 | Exceptional $62,689 |
| Immigrants | Belarus | 100.0 /100 | #43 | Exceptional $62,658 |
| Cambodians | 100.0 /100 | #44 | Exceptional $62,516 |
| Bulgarians | 100.0 /100 | #45 | Exceptional $62,378 |
| Immigrants | Czechoslovakia | 99.9 /100 | #46 | Exceptional $62,217 |
| Immigrants | Austria | 99.9 /100 | #47 | Exceptional $62,164 |
| Immigrants | Malaysia | 99.9 /100 | #48 | Exceptional $62,121 |
| Immigrants | Europe | 99.9 /100 | #49 | Exceptional $62,057 |
| Bhutanese | 99.9 /100 | #50 | Exceptional $61,759 |
| Estonians | 99.9 /100 | #51 | Exceptional $61,710 |
Demographics Similar to Immigrants from Portugal by Median Male Earnings
In terms of median male earnings, the demographic groups most similar to Immigrants from Portugal are Immigrants from South Eastern Asia ($55,241, a difference of 0.11%), Ugandan ($55,290, a difference of 0.20%), French ($55,350, a difference of 0.31%), Belgian ($55,361, a difference of 0.32%), and Basque ($55,370, a difference of 0.34%).
| Demographics | Rating | Rank | Median Male Earnings |
| Czechoslovakians | 70.5 /100 | #158 | Good $55,382 |
| Alsatians | 70.5 /100 | #159 | Good $55,380 |
| Basques | 70.3 /100 | #160 | Good $55,370 |
| Belgians | 70.1 /100 | #161 | Good $55,361 |
| French | 69.9 /100 | #162 | Good $55,350 |
| Ugandans | 68.6 /100 | #163 | Good $55,290 |
| Immigrants | South Eastern Asia | 67.6 /100 | #164 | Good $55,241 |
| Immigrants | Portugal | 66.3 /100 | #165 | Good $55,182 |
| Germans | 61.6 /100 | #166 | Good $54,974 |
| Immigrants | Fiji | 61.2 /100 | #167 | Good $54,958 |
| Immigrants | Vietnam | 60.2 /100 | #168 | Good $54,913 |
| French Canadians | 55.6 /100 | #169 | Average $54,722 |
| Finns | 55.6 /100 | #170 | Average $54,721 |
| Immigrants | Peru | 54.9 /100 | #171 | Average $54,695 |
| Welsh | 53.8 /100 | #172 | Average $54,647 |