Cambodian vs Immigrants from Indonesia Median Male Earnings
COMPARE
Cambodian
Immigrants from Indonesia
Median Male Earnings
Median Male Earnings Comparison
Cambodians
Immigrants from Indonesia
$62,516
MEDIAN MALE EARNINGS
100.0/ 100
METRIC RATING
44th/ 347
METRIC RANK
$60,935
MEDIAN MALE EARNINGS
99.8/ 100
METRIC RATING
65th/ 347
METRIC RANK
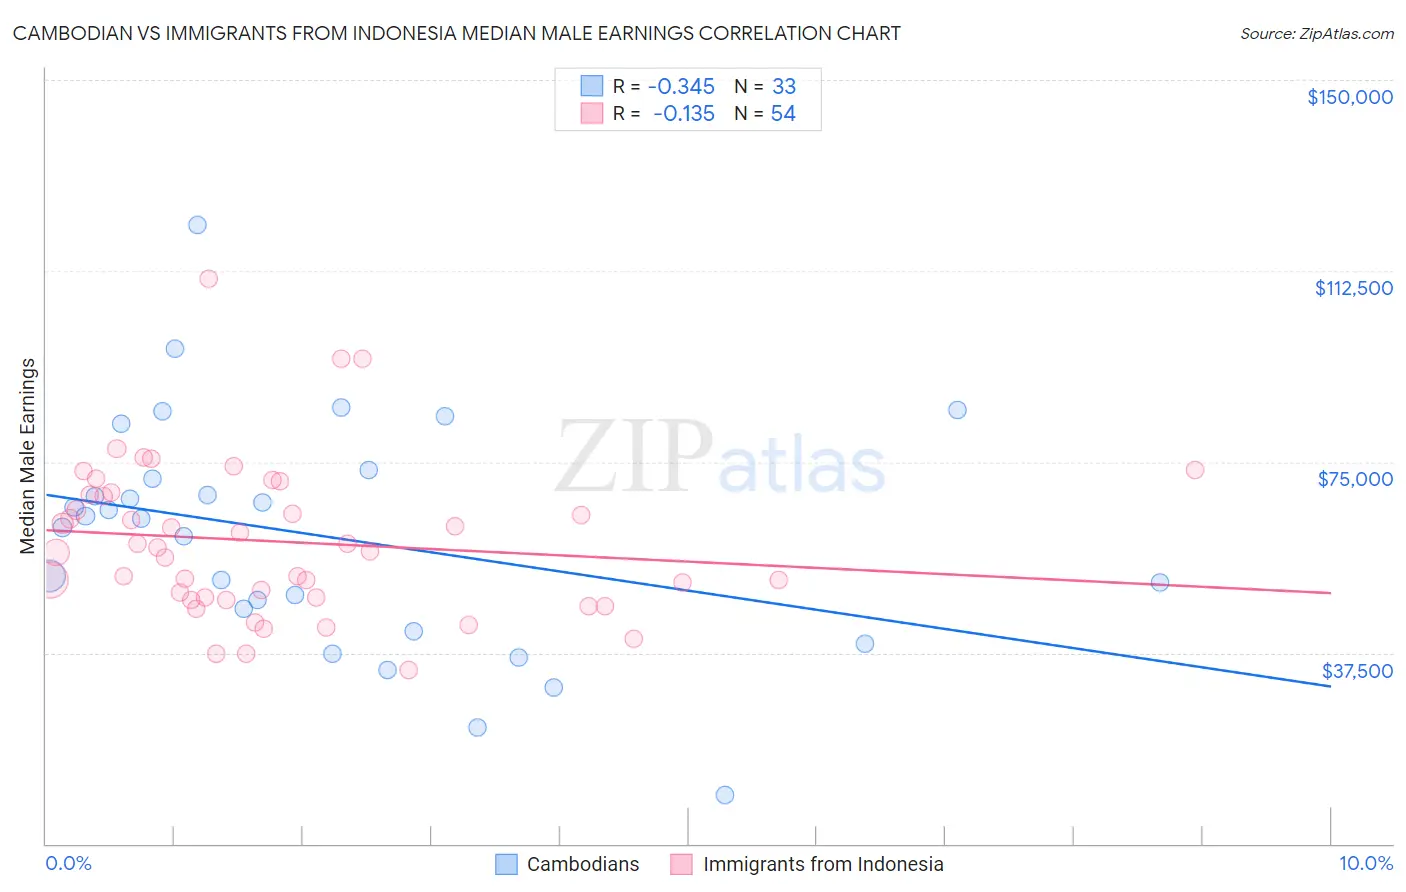
Cambodian vs Immigrants from Indonesia Median Male Earnings Correlation Chart
The statistical analysis conducted on geographies consisting of 102,506,129 people shows a mild negative correlation between the proportion of Cambodians and median male earnings in the United States with a correlation coefficient (R) of -0.345 and weighted average of $62,516. Similarly, the statistical analysis conducted on geographies consisting of 215,756,061 people shows a poor negative correlation between the proportion of Immigrants from Indonesia and median male earnings in the United States with a correlation coefficient (R) of -0.135 and weighted average of $60,935, a difference of 2.6%.
Median Male Earnings Correlation Summary
| Measurement | Cambodian | Immigrants from Indonesia |
| Minimum | $9,467 | $34,072 |
| Maximum | $121,577 | $111,048 |
| Range | $112,110 | $76,976 |
| Mean | $60,326 | $59,341 |
| Median | $63,742 | $57,826 |
| Interquartile 25% (IQ1) | $43,962 | $48,312 |
| Interquartile 75% (IQ3) | $72,546 | $68,539 |
| Interquartile Range (IQR) | $28,584 | $20,227 |
| Standard Deviation (Sample) | $22,914 | $15,206 |
| Standard Deviation (Population) | $22,564 | $15,065 |
Similar Demographics by Median Male Earnings
Demographics Similar to Cambodians by Median Male Earnings
In terms of median male earnings, the demographic groups most similar to Cambodians are Bulgarian ($62,378, a difference of 0.22%), Immigrants from Belarus ($62,658, a difference of 0.23%), Immigrants from Greece ($62,689, a difference of 0.28%), Immigrants from Turkey ($62,728, a difference of 0.34%), and Immigrants from Czechoslovakia ($62,217, a difference of 0.48%).
| Demographics | Rating | Rank | Median Male Earnings |
| Immigrants | Sri Lanka | 100.0 /100 | #37 | Exceptional $63,099 |
| Maltese | 100.0 /100 | #38 | Exceptional $62,953 |
| Immigrants | South Africa | 100.0 /100 | #39 | Exceptional $62,899 |
| Australians | 100.0 /100 | #40 | Exceptional $62,857 |
| Immigrants | Turkey | 100.0 /100 | #41 | Exceptional $62,728 |
| Immigrants | Greece | 100.0 /100 | #42 | Exceptional $62,689 |
| Immigrants | Belarus | 100.0 /100 | #43 | Exceptional $62,658 |
| Cambodians | 100.0 /100 | #44 | Exceptional $62,516 |
| Bulgarians | 100.0 /100 | #45 | Exceptional $62,378 |
| Immigrants | Czechoslovakia | 99.9 /100 | #46 | Exceptional $62,217 |
| Immigrants | Austria | 99.9 /100 | #47 | Exceptional $62,164 |
| Immigrants | Malaysia | 99.9 /100 | #48 | Exceptional $62,121 |
| Immigrants | Europe | 99.9 /100 | #49 | Exceptional $62,057 |
| Bhutanese | 99.9 /100 | #50 | Exceptional $61,759 |
| Estonians | 99.9 /100 | #51 | Exceptional $61,710 |
Demographics Similar to Immigrants from Indonesia by Median Male Earnings
In terms of median male earnings, the demographic groups most similar to Immigrants from Indonesia are Immigrants from Croatia ($60,914, a difference of 0.030%), Immigrants from Eastern Europe ($60,958, a difference of 0.040%), Immigrants from Pakistan ($60,987, a difference of 0.080%), Immigrants from Romania ($61,040, a difference of 0.17%), and Bolivian ($61,066, a difference of 0.21%).
| Demographics | Rating | Rank | Median Male Earnings |
| New Zealanders | 99.9 /100 | #58 | Exceptional $61,199 |
| Immigrants | Netherlands | 99.8 /100 | #59 | Exceptional $61,096 |
| Egyptians | 99.8 /100 | #60 | Exceptional $61,095 |
| Bolivians | 99.8 /100 | #61 | Exceptional $61,066 |
| Immigrants | Romania | 99.8 /100 | #62 | Exceptional $61,040 |
| Immigrants | Pakistan | 99.8 /100 | #63 | Exceptional $60,987 |
| Immigrants | Eastern Europe | 99.8 /100 | #64 | Exceptional $60,958 |
| Immigrants | Indonesia | 99.8 /100 | #65 | Exceptional $60,935 |
| Immigrants | Croatia | 99.8 /100 | #66 | Exceptional $60,914 |
| Immigrants | Spain | 99.8 /100 | #67 | Exceptional $60,750 |
| Immigrants | Serbia | 99.7 /100 | #68 | Exceptional $60,600 |
| Immigrants | Canada | 99.7 /100 | #69 | Exceptional $60,388 |
| Immigrants | Bulgaria | 99.7 /100 | #70 | Exceptional $60,358 |
| Mongolians | 99.7 /100 | #71 | Exceptional $60,350 |
| Immigrants | Western Europe | 99.7 /100 | #72 | Exceptional $60,334 |