Cuban vs Immigrants from Colombia Median Male Earnings
COMPARE
Cuban
Immigrants from Colombia
Median Male Earnings
Median Male Earnings Comparison
Cubans
Immigrants from Colombia
$46,580
MEDIAN MALE EARNINGS
0.0/ 100
METRIC RATING
310th/ 347
METRIC RANK
$52,725
MEDIAN MALE EARNINGS
15.0/ 100
METRIC RATING
205th/ 347
METRIC RANK
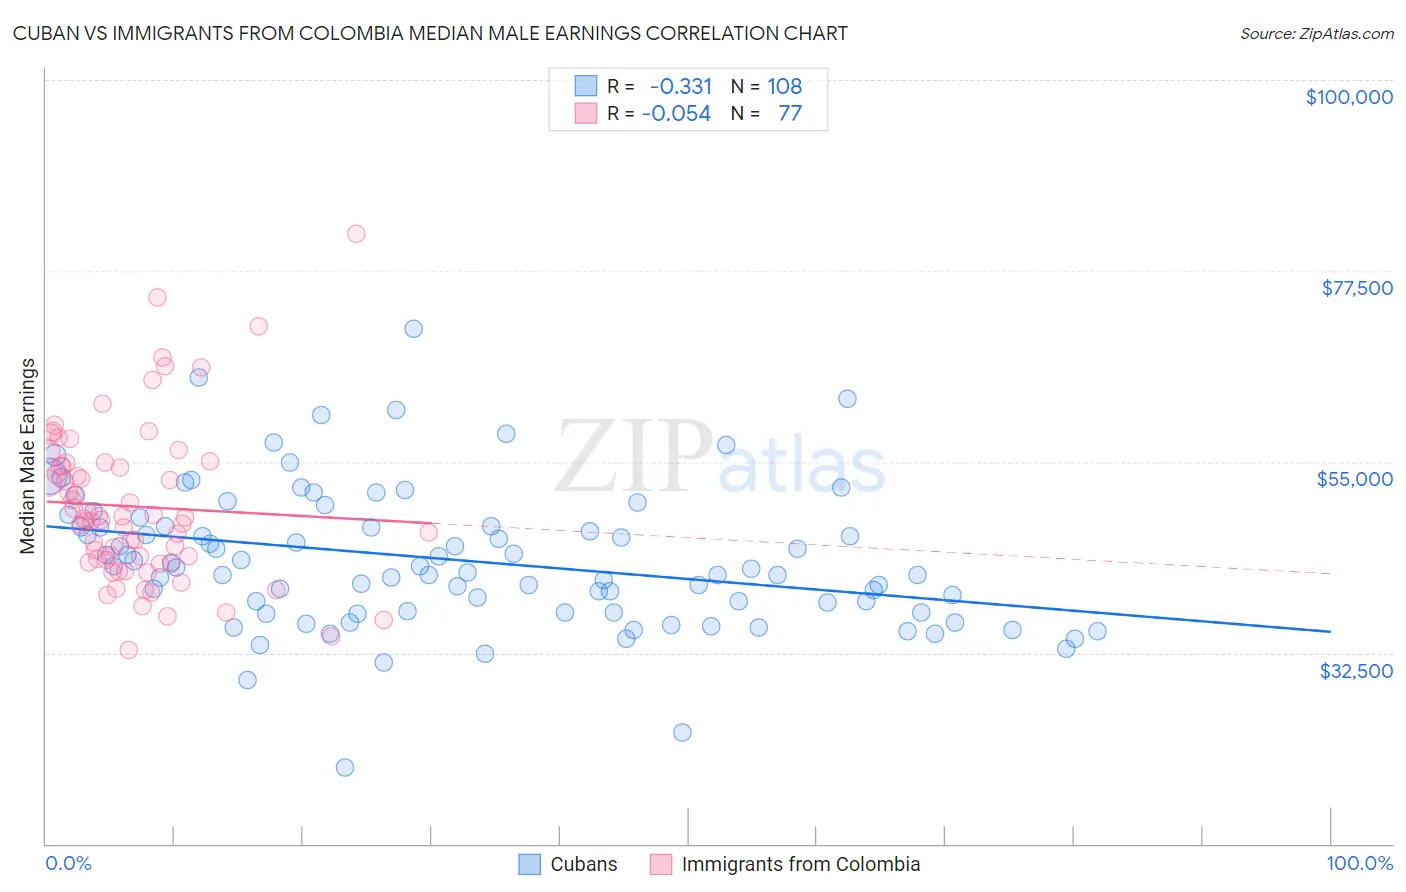
Cuban vs Immigrants from Colombia Median Male Earnings Correlation Chart
The statistical analysis conducted on geographies consisting of 449,183,844 people shows a mild negative correlation between the proportion of Cubans and median male earnings in the United States with a correlation coefficient (R) of -0.331 and weighted average of $46,580. Similarly, the statistical analysis conducted on geographies consisting of 378,593,479 people shows a slight negative correlation between the proportion of Immigrants from Colombia and median male earnings in the United States with a correlation coefficient (R) of -0.054 and weighted average of $52,725, a difference of 13.2%.
Median Male Earnings Correlation Summary
| Measurement | Cuban | Immigrants from Colombia |
| Minimum | $18,938 | $32,886 |
| Maximum | $70,693 | $81,875 |
| Range | $51,755 | $48,989 |
| Mean | $43,444 | $49,733 |
| Median | $42,447 | $48,323 |
| Interquartile 25% (IQ1) | $37,372 | $43,300 |
| Interquartile 75% (IQ3) | $47,400 | $54,661 |
| Interquartile Range (IQR) | $10,028 | $11,361 |
| Standard Deviation (Sample) | $8,309 | $9,264 |
| Standard Deviation (Population) | $8,270 | $9,204 |
Similar Demographics by Median Male Earnings
Demographics Similar to Cubans by Median Male Earnings
In terms of median male earnings, the demographic groups most similar to Cubans are Creek ($46,594, a difference of 0.030%), Ottawa ($46,611, a difference of 0.070%), Dutch West Indian ($46,656, a difference of 0.16%), Immigrants from Dominican Republic ($46,655, a difference of 0.16%), and Apache ($46,429, a difference of 0.33%).
| Demographics | Rating | Rank | Median Male Earnings |
| Yaqui | 0.1 /100 | #303 | Tragic $46,777 |
| Bangladeshis | 0.1 /100 | #304 | Tragic $46,744 |
| Guatemalans | 0.0 /100 | #305 | Tragic $46,736 |
| Dutch West Indians | 0.0 /100 | #306 | Tragic $46,656 |
| Immigrants | Dominican Republic | 0.0 /100 | #307 | Tragic $46,655 |
| Ottawa | 0.0 /100 | #308 | Tragic $46,611 |
| Creek | 0.0 /100 | #309 | Tragic $46,594 |
| Cubans | 0.0 /100 | #310 | Tragic $46,580 |
| Apache | 0.0 /100 | #311 | Tragic $46,429 |
| Hispanics or Latinos | 0.0 /100 | #312 | Tragic $46,419 |
| Hondurans | 0.0 /100 | #313 | Tragic $46,374 |
| Chippewa | 0.0 /100 | #314 | Tragic $46,368 |
| Immigrants | Guatemala | 0.0 /100 | #315 | Tragic $46,244 |
| Immigrants | Caribbean | 0.0 /100 | #316 | Tragic $46,193 |
| Mexicans | 0.0 /100 | #317 | Tragic $46,147 |
Demographics Similar to Immigrants from Colombia by Median Male Earnings
In terms of median male earnings, the demographic groups most similar to Immigrants from Colombia are Immigrants from Iraq ($52,681, a difference of 0.080%), Ghanaian ($52,810, a difference of 0.16%), Panamanian ($52,835, a difference of 0.21%), Immigrants from Uruguay ($52,860, a difference of 0.26%), and Immigrants from Bosnia and Herzegovina ($52,869, a difference of 0.27%).
| Demographics | Rating | Rank | Median Male Earnings |
| Immigrants | Costa Rica | 22.6 /100 | #198 | Fair $53,237 |
| Tongans | 22.3 /100 | #199 | Fair $53,218 |
| Immigrants | Thailand | 17.5 /100 | #200 | Poor $52,908 |
| Immigrants | Bosnia and Herzegovina | 16.9 /100 | #201 | Poor $52,869 |
| Immigrants | Uruguay | 16.8 /100 | #202 | Poor $52,860 |
| Panamanians | 16.5 /100 | #203 | Poor $52,835 |
| Ghanaians | 16.1 /100 | #204 | Poor $52,810 |
| Immigrants | Colombia | 15.0 /100 | #205 | Poor $52,725 |
| Immigrants | Iraq | 14.5 /100 | #206 | Poor $52,681 |
| Vietnamese | 12.7 /100 | #207 | Poor $52,525 |
| Venezuelans | 12.5 /100 | #208 | Poor $52,510 |
| Bermudans | 12.1 /100 | #209 | Poor $52,465 |
| Delaware | 11.5 /100 | #210 | Poor $52,412 |
| Tlingit-Haida | 11.5 /100 | #211 | Poor $52,409 |
| Cajuns | 10.7 /100 | #212 | Poor $52,325 |