Cambodian vs Immigrants from Colombia Single Mother Poverty
COMPARE
Cambodian
Immigrants from Colombia
Single Mother Poverty
Single Mother Poverty Comparison
Cambodians
Immigrants from Colombia
27.0%
SINGLE MOTHER POVERTY
99.8/ 100
METRIC RATING
49th/ 347
METRIC RANK
28.5%
SINGLE MOTHER POVERTY
88.0/ 100
METRIC RATING
140th/ 347
METRIC RANK
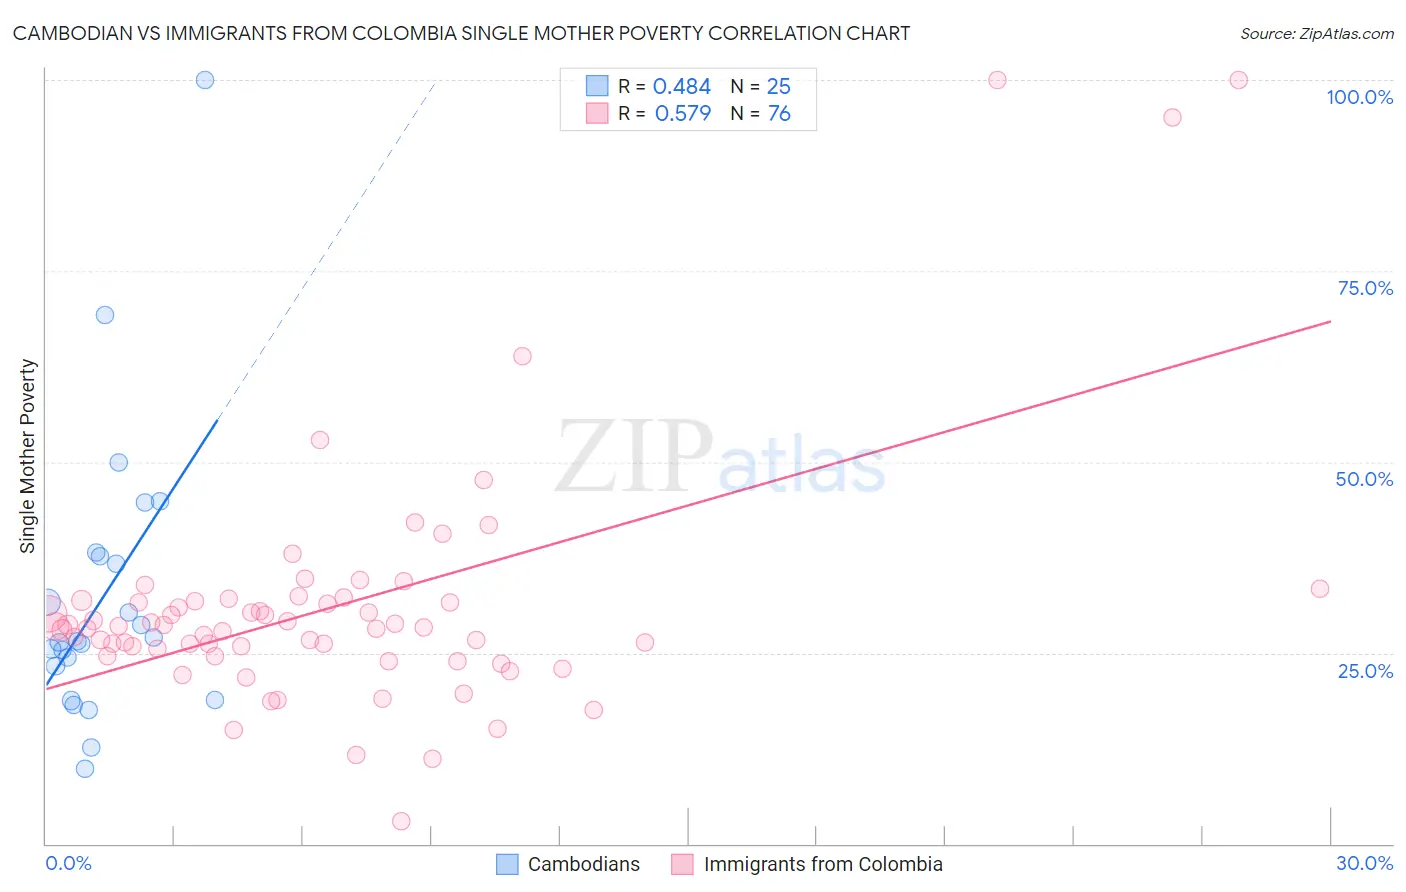
Cambodian vs Immigrants from Colombia Single Mother Poverty Correlation Chart
The statistical analysis conducted on geographies consisting of 101,772,823 people shows a moderate positive correlation between the proportion of Cambodians and poverty level among single mothers in the United States with a correlation coefficient (R) of 0.484 and weighted average of 27.0%. Similarly, the statistical analysis conducted on geographies consisting of 370,210,316 people shows a substantial positive correlation between the proportion of Immigrants from Colombia and poverty level among single mothers in the United States with a correlation coefficient (R) of 0.579 and weighted average of 28.5%, a difference of 5.6%.
Single Mother Poverty Correlation Summary
| Measurement | Cambodian | Immigrants from Colombia |
| Minimum | 9.8% | 2.9% |
| Maximum | 100.0% | 100.0% |
| Range | 90.2% | 97.1% |
| Mean | 32.5% | 31.0% |
| Median | 26.5% | 28.3% |
| Interquartile 25% (IQ1) | 21.0% | 25.1% |
| Interquartile 75% (IQ3) | 37.8% | 31.8% |
| Interquartile Range (IQR) | 16.8% | 6.7% |
| Standard Deviation (Sample) | 19.1% | 16.2% |
| Standard Deviation (Population) | 18.7% | 16.1% |
Similar Demographics by Single Mother Poverty
Demographics Similar to Cambodians by Single Mother Poverty
In terms of single mother poverty, the demographic groups most similar to Cambodians are Laotian (27.0%, a difference of 0.010%), Immigrants from Poland (26.9%, a difference of 0.080%), Egyptian (26.9%, a difference of 0.16%), Immigrants from Serbia (26.9%, a difference of 0.22%), and Latvian (26.9%, a difference of 0.26%).
| Demographics | Rating | Rank | Single Mother Poverty |
| Armenians | 99.9 /100 | #42 | Exceptional 26.8% |
| Tsimshian | 99.9 /100 | #43 | Exceptional 26.8% |
| Immigrants | Sierra Leone | 99.9 /100 | #44 | Exceptional 26.9% |
| Latvians | 99.9 /100 | #45 | Exceptional 26.9% |
| Immigrants | Serbia | 99.9 /100 | #46 | Exceptional 26.9% |
| Egyptians | 99.8 /100 | #47 | Exceptional 26.9% |
| Immigrants | Poland | 99.8 /100 | #48 | Exceptional 26.9% |
| Cambodians | 99.8 /100 | #49 | Exceptional 27.0% |
| Laotians | 99.8 /100 | #50 | Exceptional 27.0% |
| Immigrants | Argentina | 99.7 /100 | #51 | Exceptional 27.1% |
| Immigrants | South Eastern Asia | 99.7 /100 | #52 | Exceptional 27.1% |
| Immigrants | Jordan | 99.7 /100 | #53 | Exceptional 27.1% |
| Immigrants | Bulgaria | 99.7 /100 | #54 | Exceptional 27.1% |
| Immigrants | Egypt | 99.7 /100 | #55 | Exceptional 27.1% |
| Immigrants | Romania | 99.7 /100 | #56 | Exceptional 27.2% |
Demographics Similar to Immigrants from Colombia by Single Mother Poverty
In terms of single mother poverty, the demographic groups most similar to Immigrants from Colombia are Samoan (28.5%, a difference of 0.010%), Immigrants from Belgium (28.5%, a difference of 0.060%), Danish (28.5%, a difference of 0.10%), Native Hawaiian (28.4%, a difference of 0.11%), and Immigrants from Canada (28.4%, a difference of 0.11%).
| Demographics | Rating | Rank | Single Mother Poverty |
| Swedes | 89.4 /100 | #133 | Excellent 28.4% |
| Immigrants | Southern Europe | 89.2 /100 | #134 | Excellent 28.4% |
| Immigrants | Spain | 89.2 /100 | #135 | Excellent 28.4% |
| Native Hawaiians | 88.9 /100 | #136 | Excellent 28.4% |
| Immigrants | Canada | 88.9 /100 | #137 | Excellent 28.4% |
| Immigrants | Belgium | 88.5 /100 | #138 | Excellent 28.5% |
| Samoans | 88.1 /100 | #139 | Excellent 28.5% |
| Immigrants | Colombia | 88.0 /100 | #140 | Excellent 28.5% |
| Danes | 87.1 /100 | #141 | Excellent 28.5% |
| South Africans | 86.6 /100 | #142 | Excellent 28.5% |
| Immigrants | North America | 86.5 /100 | #143 | Excellent 28.5% |
| Luxembourgers | 86.4 /100 | #144 | Excellent 28.5% |
| Immigrants | South America | 86.1 /100 | #145 | Excellent 28.5% |
| Immigrants | Denmark | 86.1 /100 | #146 | Excellent 28.5% |
| Immigrants | Lebanon | 85.3 /100 | #147 | Excellent 28.6% |