Immigrants from Cambodia vs Immigrants from Colombia Median Male Earnings
COMPARE
Immigrants from Cambodia
Immigrants from Colombia
Median Male Earnings
Median Male Earnings Comparison
Immigrants from Cambodia
Immigrants from Colombia
$51,594
MEDIAN MALE EARNINGS
5.5/ 100
METRIC RATING
224th/ 347
METRIC RANK
$52,725
MEDIAN MALE EARNINGS
15.0/ 100
METRIC RATING
205th/ 347
METRIC RANK
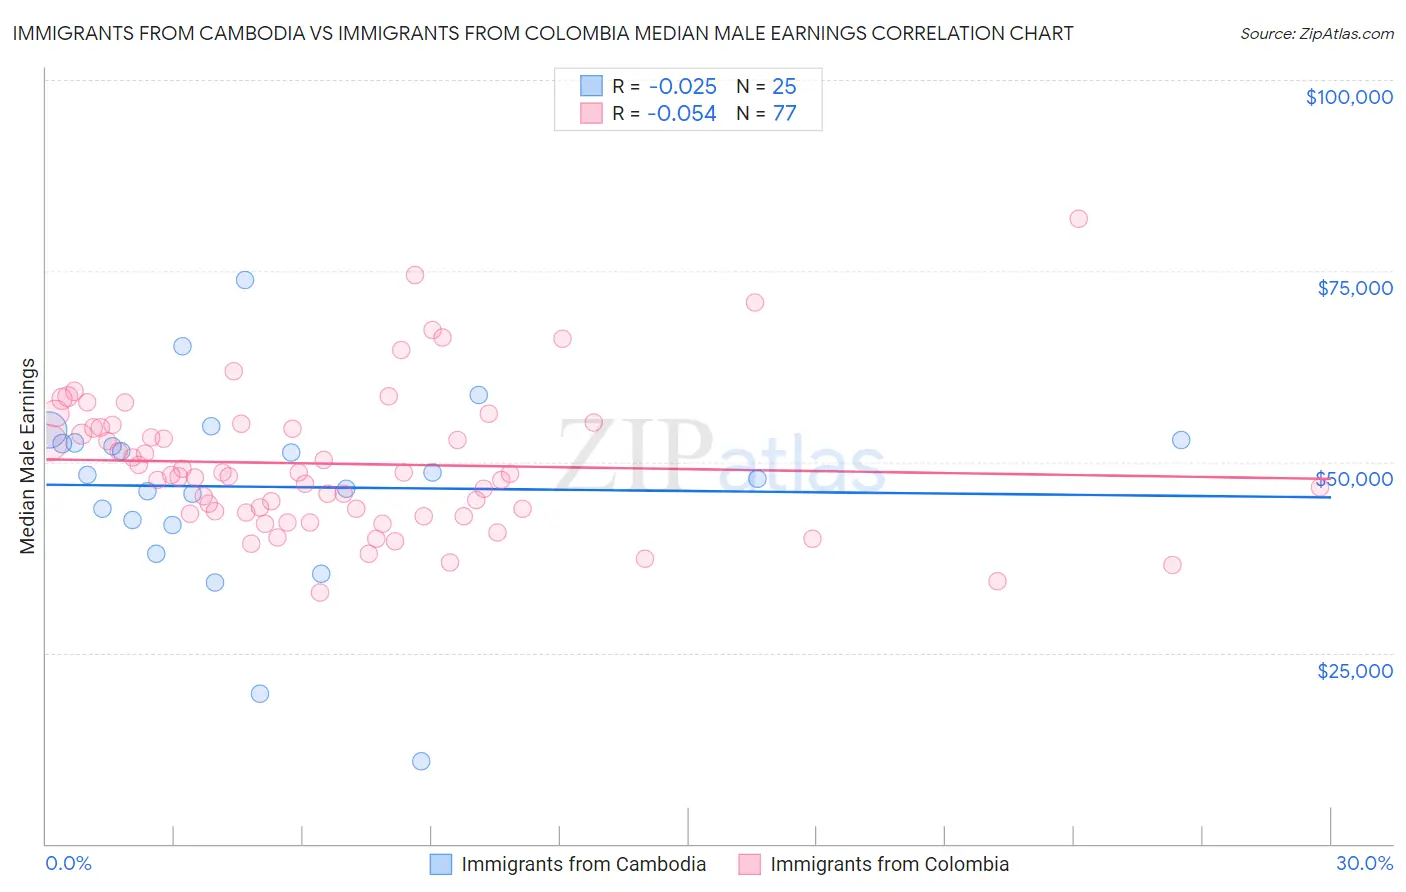
Immigrants from Cambodia vs Immigrants from Colombia Median Male Earnings Correlation Chart
The statistical analysis conducted on geographies consisting of 205,144,142 people shows no correlation between the proportion of Immigrants from Cambodia and median male earnings in the United States with a correlation coefficient (R) of -0.025 and weighted average of $51,594. Similarly, the statistical analysis conducted on geographies consisting of 378,593,479 people shows a slight negative correlation between the proportion of Immigrants from Colombia and median male earnings in the United States with a correlation coefficient (R) of -0.054 and weighted average of $52,725, a difference of 2.2%.
Median Male Earnings Correlation Summary
| Measurement | Immigrants from Cambodia | Immigrants from Colombia |
| Minimum | $10,761 | $32,886 |
| Maximum | $73,759 | $81,875 |
| Range | $62,998 | $48,989 |
| Mean | $46,720 | $49,733 |
| Median | $48,267 | $48,323 |
| Interquartile 25% (IQ1) | $42,101 | $43,300 |
| Interquartile 75% (IQ3) | $52,654 | $54,661 |
| Interquartile Range (IQR) | $10,554 | $11,361 |
| Standard Deviation (Sample) | $12,824 | $9,264 |
| Standard Deviation (Population) | $12,565 | $9,204 |
Demographics Similar to Immigrants from Cambodia and Immigrants from Colombia by Median Male Earnings
In terms of median male earnings, the demographic groups most similar to Immigrants from Cambodia are Ecuadorian ($51,596, a difference of 0.0%), Immigrants from Bangladesh ($51,642, a difference of 0.090%), Immigrants from Senegal ($51,647, a difference of 0.10%), Immigrants from Armenia ($51,793, a difference of 0.39%), and Immigrants from Ghana ($51,836, a difference of 0.47%). Similarly, the demographic groups most similar to Immigrants from Colombia are Immigrants from Iraq ($52,681, a difference of 0.080%), Ghanaian ($52,810, a difference of 0.16%), Vietnamese ($52,525, a difference of 0.38%), Venezuelan ($52,510, a difference of 0.41%), and Bermudan ($52,465, a difference of 0.50%).
| Demographics | Rating | Rank | Median Male Earnings |
| Ghanaians | 16.1 /100 | #204 | Poor $52,810 |
| Immigrants | Colombia | 15.0 /100 | #205 | Poor $52,725 |
| Immigrants | Iraq | 14.5 /100 | #206 | Poor $52,681 |
| Vietnamese | 12.7 /100 | #207 | Poor $52,525 |
| Venezuelans | 12.5 /100 | #208 | Poor $52,510 |
| Bermudans | 12.1 /100 | #209 | Poor $52,465 |
| Delaware | 11.5 /100 | #210 | Poor $52,412 |
| Tlingit-Haida | 11.5 /100 | #211 | Poor $52,409 |
| Cajuns | 10.7 /100 | #212 | Poor $52,325 |
| Native Hawaiians | 10.5 /100 | #213 | Poor $52,306 |
| Immigrants | Nonimmigrants | 9.3 /100 | #214 | Tragic $52,170 |
| Immigrants | Cameroon | 8.9 /100 | #215 | Tragic $52,119 |
| Immigrants | Venezuela | 8.3 /100 | #216 | Tragic $52,041 |
| Nigerians | 8.3 /100 | #217 | Tragic $52,039 |
| Immigrants | Panama | 7.7 /100 | #218 | Tragic $51,962 |
| Immigrants | Ghana | 6.9 /100 | #219 | Tragic $51,836 |
| Immigrants | Armenia | 6.6 /100 | #220 | Tragic $51,793 |
| Immigrants | Senegal | 5.8 /100 | #221 | Tragic $51,647 |
| Immigrants | Bangladesh | 5.8 /100 | #222 | Tragic $51,642 |
| Ecuadorians | 5.5 /100 | #223 | Tragic $51,596 |
| Immigrants | Cambodia | 5.5 /100 | #224 | Tragic $51,594 |