Latvian vs Immigrants from Colombia Median Male Earnings
COMPARE
Latvian
Immigrants from Colombia
Median Male Earnings
Median Male Earnings Comparison
Latvians
Immigrants from Colombia
$63,498
MEDIAN MALE EARNINGS
100.0/ 100
METRIC RATING
31st/ 347
METRIC RANK
$52,725
MEDIAN MALE EARNINGS
15.0/ 100
METRIC RATING
205th/ 347
METRIC RANK
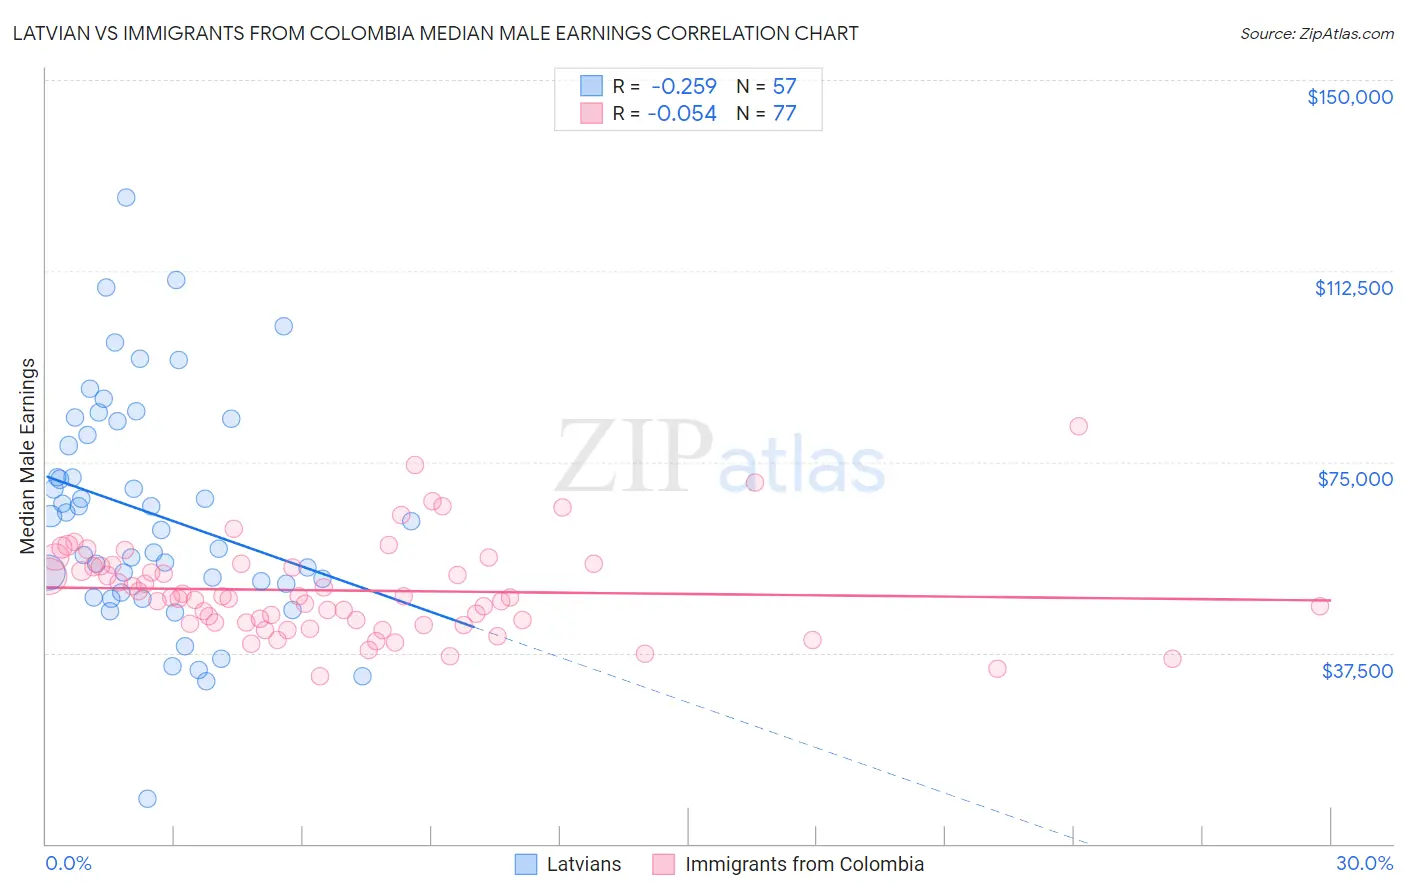
Latvian vs Immigrants from Colombia Median Male Earnings Correlation Chart
The statistical analysis conducted on geographies consisting of 220,682,058 people shows a weak negative correlation between the proportion of Latvians and median male earnings in the United States with a correlation coefficient (R) of -0.259 and weighted average of $63,498. Similarly, the statistical analysis conducted on geographies consisting of 378,593,479 people shows a slight negative correlation between the proportion of Immigrants from Colombia and median male earnings in the United States with a correlation coefficient (R) of -0.054 and weighted average of $52,725, a difference of 20.4%.
Median Male Earnings Correlation Summary
| Measurement | Latvian | Immigrants from Colombia |
| Minimum | $8,856 | $32,886 |
| Maximum | $126,871 | $81,875 |
| Range | $118,015 | $48,989 |
| Mean | $64,757 | $49,733 |
| Median | $63,438 | $48,323 |
| Interquartile 25% (IQ1) | $50,186 | $43,300 |
| Interquartile 75% (IQ3) | $81,584 | $54,661 |
| Interquartile Range (IQR) | $31,398 | $11,361 |
| Standard Deviation (Sample) | $22,394 | $9,264 |
| Standard Deviation (Population) | $22,197 | $9,204 |
Similar Demographics by Median Male Earnings
Demographics Similar to Latvians by Median Male Earnings
In terms of median male earnings, the demographic groups most similar to Latvians are Soviet Union ($63,382, a difference of 0.18%), Immigrants from Lithuania ($63,346, a difference of 0.24%), Immigrants from Russia ($63,326, a difference of 0.27%), Immigrants from France ($63,715, a difference of 0.34%), and Immigrants from Asia ($63,240, a difference of 0.41%).
| Demographics | Rating | Rank | Median Male Earnings |
| Immigrants | Northern Europe | 100.0 /100 | #24 | Exceptional $64,987 |
| Immigrants | Denmark | 100.0 /100 | #25 | Exceptional $64,625 |
| Turks | 100.0 /100 | #26 | Exceptional $64,253 |
| Immigrants | Switzerland | 100.0 /100 | #27 | Exceptional $63,944 |
| Russians | 100.0 /100 | #28 | Exceptional $63,939 |
| Asians | 100.0 /100 | #29 | Exceptional $63,827 |
| Immigrants | France | 100.0 /100 | #30 | Exceptional $63,715 |
| Latvians | 100.0 /100 | #31 | Exceptional $63,498 |
| Soviet Union | 100.0 /100 | #32 | Exceptional $63,382 |
| Immigrants | Lithuania | 100.0 /100 | #33 | Exceptional $63,346 |
| Immigrants | Russia | 100.0 /100 | #34 | Exceptional $63,326 |
| Immigrants | Asia | 100.0 /100 | #35 | Exceptional $63,240 |
| Israelis | 100.0 /100 | #36 | Exceptional $63,228 |
| Immigrants | Sri Lanka | 100.0 /100 | #37 | Exceptional $63,099 |
| Maltese | 100.0 /100 | #38 | Exceptional $62,953 |
Demographics Similar to Immigrants from Colombia by Median Male Earnings
In terms of median male earnings, the demographic groups most similar to Immigrants from Colombia are Immigrants from Iraq ($52,681, a difference of 0.080%), Ghanaian ($52,810, a difference of 0.16%), Panamanian ($52,835, a difference of 0.21%), Immigrants from Uruguay ($52,860, a difference of 0.26%), and Immigrants from Bosnia and Herzegovina ($52,869, a difference of 0.27%).
| Demographics | Rating | Rank | Median Male Earnings |
| Immigrants | Costa Rica | 22.6 /100 | #198 | Fair $53,237 |
| Tongans | 22.3 /100 | #199 | Fair $53,218 |
| Immigrants | Thailand | 17.5 /100 | #200 | Poor $52,908 |
| Immigrants | Bosnia and Herzegovina | 16.9 /100 | #201 | Poor $52,869 |
| Immigrants | Uruguay | 16.8 /100 | #202 | Poor $52,860 |
| Panamanians | 16.5 /100 | #203 | Poor $52,835 |
| Ghanaians | 16.1 /100 | #204 | Poor $52,810 |
| Immigrants | Colombia | 15.0 /100 | #205 | Poor $52,725 |
| Immigrants | Iraq | 14.5 /100 | #206 | Poor $52,681 |
| Vietnamese | 12.7 /100 | #207 | Poor $52,525 |
| Venezuelans | 12.5 /100 | #208 | Poor $52,510 |
| Bermudans | 12.1 /100 | #209 | Poor $52,465 |
| Delaware | 11.5 /100 | #210 | Poor $52,412 |
| Tlingit-Haida | 11.5 /100 | #211 | Poor $52,409 |
| Cajuns | 10.7 /100 | #212 | Poor $52,325 |