Scandinavian vs Immigrants from Colombia Median Male Earnings
COMPARE
Scandinavian
Immigrants from Colombia
Median Male Earnings
Median Male Earnings Comparison
Scandinavians
Immigrants from Colombia
$55,527
MEDIAN MALE EARNINGS
73.4/ 100
METRIC RATING
155th/ 347
METRIC RANK
$52,725
MEDIAN MALE EARNINGS
15.0/ 100
METRIC RATING
205th/ 347
METRIC RANK
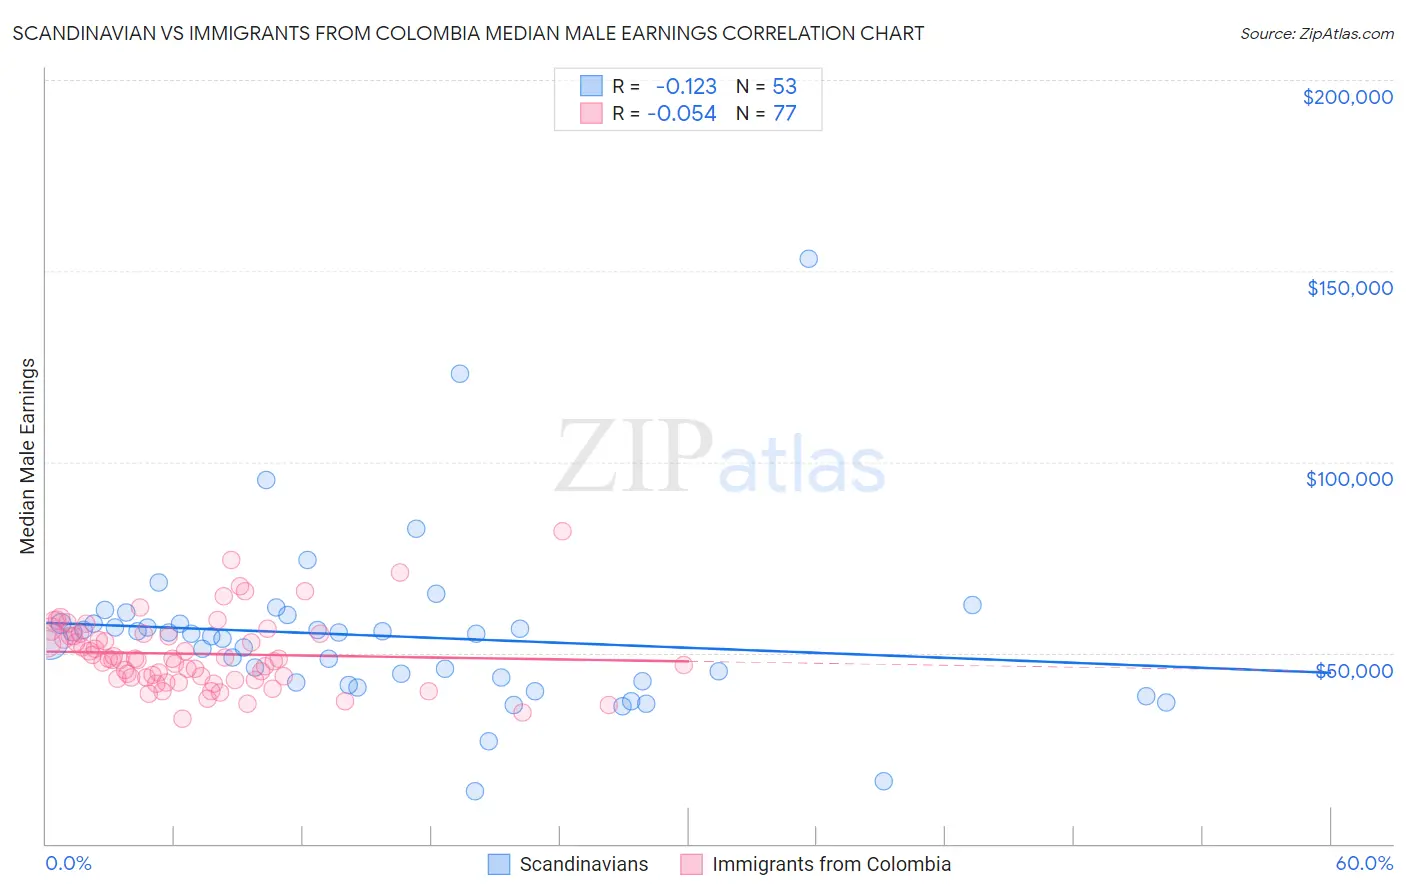
Scandinavian vs Immigrants from Colombia Median Male Earnings Correlation Chart
The statistical analysis conducted on geographies consisting of 472,245,233 people shows a poor negative correlation between the proportion of Scandinavians and median male earnings in the United States with a correlation coefficient (R) of -0.123 and weighted average of $55,527. Similarly, the statistical analysis conducted on geographies consisting of 378,593,479 people shows a slight negative correlation between the proportion of Immigrants from Colombia and median male earnings in the United States with a correlation coefficient (R) of -0.054 and weighted average of $52,725, a difference of 5.3%.
Median Male Earnings Correlation Summary
| Measurement | Scandinavian | Immigrants from Colombia |
| Minimum | $13,865 | $32,886 |
| Maximum | $153,203 | $81,875 |
| Range | $139,338 | $48,989 |
| Mean | $54,403 | $49,733 |
| Median | $55,045 | $48,323 |
| Interquartile 25% (IQ1) | $42,380 | $43,300 |
| Interquartile 75% (IQ3) | $57,674 | $54,661 |
| Interquartile Range (IQR) | $15,293 | $11,361 |
| Standard Deviation (Sample) | $21,926 | $9,264 |
| Standard Deviation (Population) | $21,718 | $9,204 |
Similar Demographics by Median Male Earnings
Demographics Similar to Scandinavians by Median Male Earnings
In terms of median male earnings, the demographic groups most similar to Scandinavians are Taiwanese ($55,556, a difference of 0.050%), Immigrants from Nepal ($55,615, a difference of 0.16%), Immigrants from Ethiopia ($55,434, a difference of 0.17%), Icelander ($55,415, a difference of 0.20%), and Peruvian ($55,659, a difference of 0.24%).
| Demographics | Rating | Rank | Median Male Earnings |
| Scottish | 78.2 /100 | #148 | Good $55,793 |
| English | 77.4 /100 | #149 | Good $55,747 |
| Swiss | 77.1 /100 | #150 | Good $55,731 |
| Immigrants | Oceania | 76.8 /100 | #151 | Good $55,712 |
| Peruvians | 75.8 /100 | #152 | Good $55,659 |
| Immigrants | Nepal | 75.0 /100 | #153 | Good $55,615 |
| Taiwanese | 73.9 /100 | #154 | Good $55,556 |
| Scandinavians | 73.4 /100 | #155 | Good $55,527 |
| Immigrants | Ethiopia | 71.6 /100 | #156 | Good $55,434 |
| Icelanders | 71.2 /100 | #157 | Good $55,415 |
| Czechoslovakians | 70.5 /100 | #158 | Good $55,382 |
| Alsatians | 70.5 /100 | #159 | Good $55,380 |
| Basques | 70.3 /100 | #160 | Good $55,370 |
| Belgians | 70.1 /100 | #161 | Good $55,361 |
| French | 69.9 /100 | #162 | Good $55,350 |
Demographics Similar to Immigrants from Colombia by Median Male Earnings
In terms of median male earnings, the demographic groups most similar to Immigrants from Colombia are Immigrants from Iraq ($52,681, a difference of 0.080%), Ghanaian ($52,810, a difference of 0.16%), Panamanian ($52,835, a difference of 0.21%), Immigrants from Uruguay ($52,860, a difference of 0.26%), and Immigrants from Bosnia and Herzegovina ($52,869, a difference of 0.27%).
| Demographics | Rating | Rank | Median Male Earnings |
| Immigrants | Costa Rica | 22.6 /100 | #198 | Fair $53,237 |
| Tongans | 22.3 /100 | #199 | Fair $53,218 |
| Immigrants | Thailand | 17.5 /100 | #200 | Poor $52,908 |
| Immigrants | Bosnia and Herzegovina | 16.9 /100 | #201 | Poor $52,869 |
| Immigrants | Uruguay | 16.8 /100 | #202 | Poor $52,860 |
| Panamanians | 16.5 /100 | #203 | Poor $52,835 |
| Ghanaians | 16.1 /100 | #204 | Poor $52,810 |
| Immigrants | Colombia | 15.0 /100 | #205 | Poor $52,725 |
| Immigrants | Iraq | 14.5 /100 | #206 | Poor $52,681 |
| Vietnamese | 12.7 /100 | #207 | Poor $52,525 |
| Venezuelans | 12.5 /100 | #208 | Poor $52,510 |
| Bermudans | 12.1 /100 | #209 | Poor $52,465 |
| Delaware | 11.5 /100 | #210 | Poor $52,412 |
| Tlingit-Haida | 11.5 /100 | #211 | Poor $52,409 |
| Cajuns | 10.7 /100 | #212 | Poor $52,325 |