Cambodian vs Australian In Labor Force | Age > 16
COMPARE
Cambodian
Australian
In Labor Force | Age > 16
In Labor Force | Age > 16 Comparison
Cambodians
Australians
67.4%
IN LABOR FORCE | AGE > 16
100.0/ 100
METRIC RATING
23rd/ 347
METRIC RANK
65.3%
IN LABOR FORCE | AGE > 16
71.3/ 100
METRIC RATING
161st/ 347
METRIC RANK
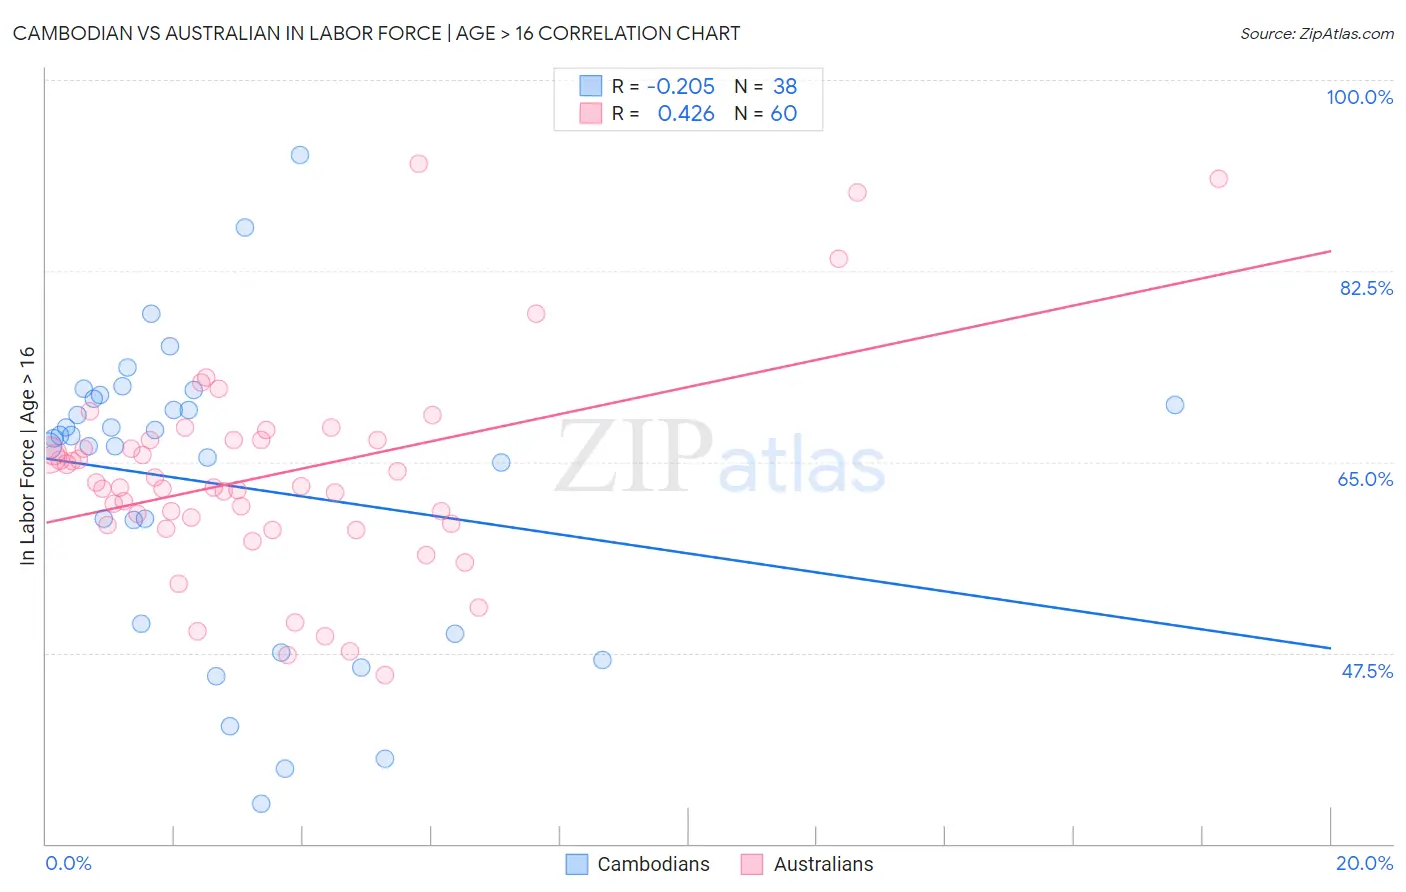
Cambodian vs Australian In Labor Force | Age > 16 Correlation Chart
The statistical analysis conducted on geographies consisting of 102,521,417 people shows a weak negative correlation between the proportion of Cambodians and labor force participation rate among population ages 16 and over in the United States with a correlation coefficient (R) of -0.205 and weighted average of 67.4%. Similarly, the statistical analysis conducted on geographies consisting of 224,163,192 people shows a moderate positive correlation between the proportion of Australians and labor force participation rate among population ages 16 and over in the United States with a correlation coefficient (R) of 0.426 and weighted average of 65.3%, a difference of 3.3%.
In Labor Force | Age > 16 Correlation Summary
| Measurement | Cambodian | Australian |
| Minimum | 33.7% | 45.5% |
| Maximum | 93.1% | 92.3% |
| Range | 59.4% | 46.8% |
| Mean | 63.0% | 63.8% |
| Median | 67.3% | 62.8% |
| Interquartile 25% (IQ1) | 50.2% | 59.2% |
| Interquartile 75% (IQ3) | 70.8% | 67.0% |
| Interquartile Range (IQR) | 20.6% | 7.8% |
| Standard Deviation (Sample) | 13.6% | 9.5% |
| Standard Deviation (Population) | 13.4% | 9.4% |
Similar Demographics by In Labor Force | Age > 16
Demographics Similar to Cambodians by In Labor Force | Age > 16
In terms of in labor force | age > 16, the demographic groups most similar to Cambodians are Ugandan (67.4%, a difference of 0.060%), Immigrants from Africa (67.4%, a difference of 0.090%), Immigrants from Uganda (67.5%, a difference of 0.12%), Immigrants from Cabo Verde (67.3%, a difference of 0.12%), and Tongan (67.5%, a difference of 0.18%).
| Demographics | Rating | Rank | In Labor Force | Age > 16 |
| Immigrants | Sudan | 100.0 /100 | #16 | Exceptional 67.7% |
| Immigrants | India | 100.0 /100 | #17 | Exceptional 67.6% |
| Immigrants | Liberia | 100.0 /100 | #18 | Exceptional 67.6% |
| Kenyans | 100.0 /100 | #19 | Exceptional 67.6% |
| Immigrants | Kenya | 100.0 /100 | #20 | Exceptional 67.6% |
| Tongans | 100.0 /100 | #21 | Exceptional 67.5% |
| Immigrants | Uganda | 100.0 /100 | #22 | Exceptional 67.5% |
| Cambodians | 100.0 /100 | #23 | Exceptional 67.4% |
| Ugandans | 100.0 /100 | #24 | Exceptional 67.4% |
| Immigrants | Africa | 100.0 /100 | #25 | Exceptional 67.4% |
| Immigrants | Cabo Verde | 100.0 /100 | #26 | Exceptional 67.3% |
| Zimbabweans | 100.0 /100 | #27 | Exceptional 67.3% |
| Immigrants | Morocco | 100.0 /100 | #28 | Exceptional 67.2% |
| Thais | 100.0 /100 | #29 | Exceptional 67.2% |
| Immigrants | Zaire | 100.0 /100 | #30 | Exceptional 67.2% |
Demographics Similar to Australians by In Labor Force | Age > 16
In terms of in labor force | age > 16, the demographic groups most similar to Australians are Albanian (65.3%, a difference of 0.010%), South African (65.3%, a difference of 0.020%), Immigrants from South Africa (65.3%, a difference of 0.030%), Danish (65.3%, a difference of 0.030%), and Immigrants from Kazakhstan (65.3%, a difference of 0.040%).
| Demographics | Rating | Rank | In Labor Force | Age > 16 |
| Immigrants | Eastern Europe | 78.3 /100 | #154 | Good 65.4% |
| Immigrants | Armenia | 76.6 /100 | #155 | Good 65.3% |
| Immigrants | Ireland | 75.9 /100 | #156 | Good 65.3% |
| Immigrants | Russia | 75.7 /100 | #157 | Good 65.3% |
| Panamanians | 75.2 /100 | #158 | Good 65.3% |
| Immigrants | Syria | 74.6 /100 | #159 | Good 65.3% |
| Immigrants | South Africa | 73.5 /100 | #160 | Good 65.3% |
| Australians | 71.3 /100 | #161 | Good 65.3% |
| Albanians | 70.8 /100 | #162 | Good 65.3% |
| South Africans | 69.8 /100 | #163 | Good 65.3% |
| Danes | 68.8 /100 | #164 | Good 65.3% |
| Immigrants | Kazakhstan | 68.1 /100 | #165 | Good 65.3% |
| Immigrants | Western Asia | 67.3 /100 | #166 | Good 65.3% |
| Immigrants | Belarus | 66.0 /100 | #167 | Good 65.2% |
| Serbians | 63.5 /100 | #168 | Good 65.2% |