Samoan vs Australian Median Male Earnings
COMPARE
Samoan
Australian
Median Male Earnings
Median Male Earnings Comparison
Samoans
Australians
$51,389
MEDIAN MALE EARNINGS
4.6/ 100
METRIC RATING
228th/ 347
METRIC RANK
$62,857
MEDIAN MALE EARNINGS
100.0/ 100
METRIC RATING
40th/ 347
METRIC RANK
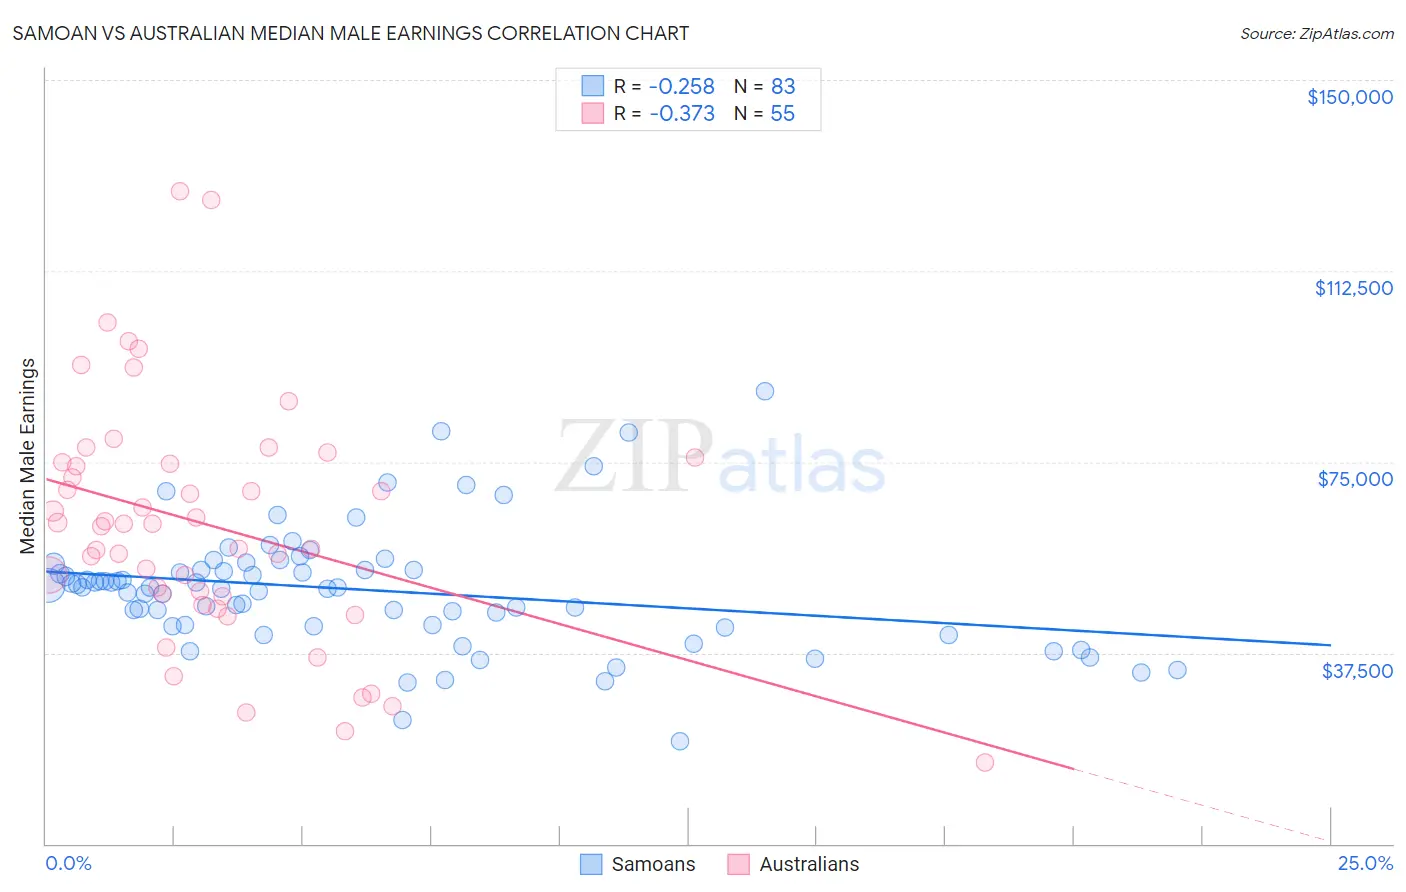
Samoan vs Australian Median Male Earnings Correlation Chart
The statistical analysis conducted on geographies consisting of 225,157,304 people shows a weak negative correlation between the proportion of Samoans and median male earnings in the United States with a correlation coefficient (R) of -0.258 and weighted average of $51,389. Similarly, the statistical analysis conducted on geographies consisting of 224,135,609 people shows a mild negative correlation between the proportion of Australians and median male earnings in the United States with a correlation coefficient (R) of -0.373 and weighted average of $62,857, a difference of 22.3%.
Median Male Earnings Correlation Summary
| Measurement | Samoan | Australian |
| Minimum | $20,179 | $15,945 |
| Maximum | $88,750 | $128,097 |
| Range | $68,571 | $112,152 |
| Mean | $49,891 | $62,501 |
| Median | $50,415 | $62,813 |
| Interquartile 25% (IQ1) | $42,816 | $48,594 |
| Interquartile 75% (IQ3) | $53,887 | $74,900 |
| Interquartile Range (IQR) | $11,071 | $26,306 |
| Standard Deviation (Sample) | $11,942 | $23,536 |
| Standard Deviation (Population) | $11,870 | $23,321 |
Similar Demographics by Median Male Earnings
Demographics Similar to Samoans by Median Male Earnings
In terms of median male earnings, the demographic groups most similar to Samoans are Immigrants from Trinidad and Tobago ($51,376, a difference of 0.030%), Trinidadian and Tobagonian ($51,446, a difference of 0.11%), Japanese ($51,473, a difference of 0.16%), Immigrants from Nigeria ($51,310, a difference of 0.16%), and Immigrants from Sudan ($51,489, a difference of 0.19%).
| Demographics | Rating | Rank | Median Male Earnings |
| Immigrants | Senegal | 5.8 /100 | #221 | Tragic $51,647 |
| Immigrants | Bangladesh | 5.8 /100 | #222 | Tragic $51,642 |
| Ecuadorians | 5.5 /100 | #223 | Tragic $51,596 |
| Immigrants | Cambodia | 5.5 /100 | #224 | Tragic $51,594 |
| Immigrants | Sudan | 5.0 /100 | #225 | Tragic $51,489 |
| Japanese | 4.9 /100 | #226 | Tragic $51,473 |
| Trinidadians and Tobagonians | 4.8 /100 | #227 | Tragic $51,446 |
| Samoans | 4.6 /100 | #228 | Tragic $51,389 |
| Immigrants | Trinidad and Tobago | 4.5 /100 | #229 | Tragic $51,376 |
| Immigrants | Nigeria | 4.2 /100 | #230 | Tragic $51,310 |
| Barbadians | 3.9 /100 | #231 | Tragic $51,236 |
| Sudanese | 3.9 /100 | #232 | Tragic $51,216 |
| Aleuts | 3.7 /100 | #233 | Tragic $51,168 |
| Cape Verdeans | 3.5 /100 | #234 | Tragic $51,103 |
| Immigrants | Western Africa | 3.0 /100 | #235 | Tragic $50,940 |
Demographics Similar to Australians by Median Male Earnings
In terms of median male earnings, the demographic groups most similar to Australians are Immigrants from South Africa ($62,899, a difference of 0.070%), Maltese ($62,953, a difference of 0.15%), Immigrants from Turkey ($62,728, a difference of 0.21%), Immigrants from Greece ($62,689, a difference of 0.27%), and Immigrants from Belarus ($62,658, a difference of 0.32%).
| Demographics | Rating | Rank | Median Male Earnings |
| Immigrants | Lithuania | 100.0 /100 | #33 | Exceptional $63,346 |
| Immigrants | Russia | 100.0 /100 | #34 | Exceptional $63,326 |
| Immigrants | Asia | 100.0 /100 | #35 | Exceptional $63,240 |
| Israelis | 100.0 /100 | #36 | Exceptional $63,228 |
| Immigrants | Sri Lanka | 100.0 /100 | #37 | Exceptional $63,099 |
| Maltese | 100.0 /100 | #38 | Exceptional $62,953 |
| Immigrants | South Africa | 100.0 /100 | #39 | Exceptional $62,899 |
| Australians | 100.0 /100 | #40 | Exceptional $62,857 |
| Immigrants | Turkey | 100.0 /100 | #41 | Exceptional $62,728 |
| Immigrants | Greece | 100.0 /100 | #42 | Exceptional $62,689 |
| Immigrants | Belarus | 100.0 /100 | #43 | Exceptional $62,658 |
| Cambodians | 100.0 /100 | #44 | Exceptional $62,516 |
| Bulgarians | 100.0 /100 | #45 | Exceptional $62,378 |
| Immigrants | Czechoslovakia | 99.9 /100 | #46 | Exceptional $62,217 |
| Immigrants | Austria | 99.9 /100 | #47 | Exceptional $62,164 |