Slovak vs Australian Median Male Earnings
COMPARE
Slovak
Australian
Median Male Earnings
Median Male Earnings Comparison
Slovaks
Australians
$56,306
MEDIAN MALE EARNINGS
85.5/ 100
METRIC RATING
138th/ 347
METRIC RANK
$62,857
MEDIAN MALE EARNINGS
100.0/ 100
METRIC RATING
40th/ 347
METRIC RANK
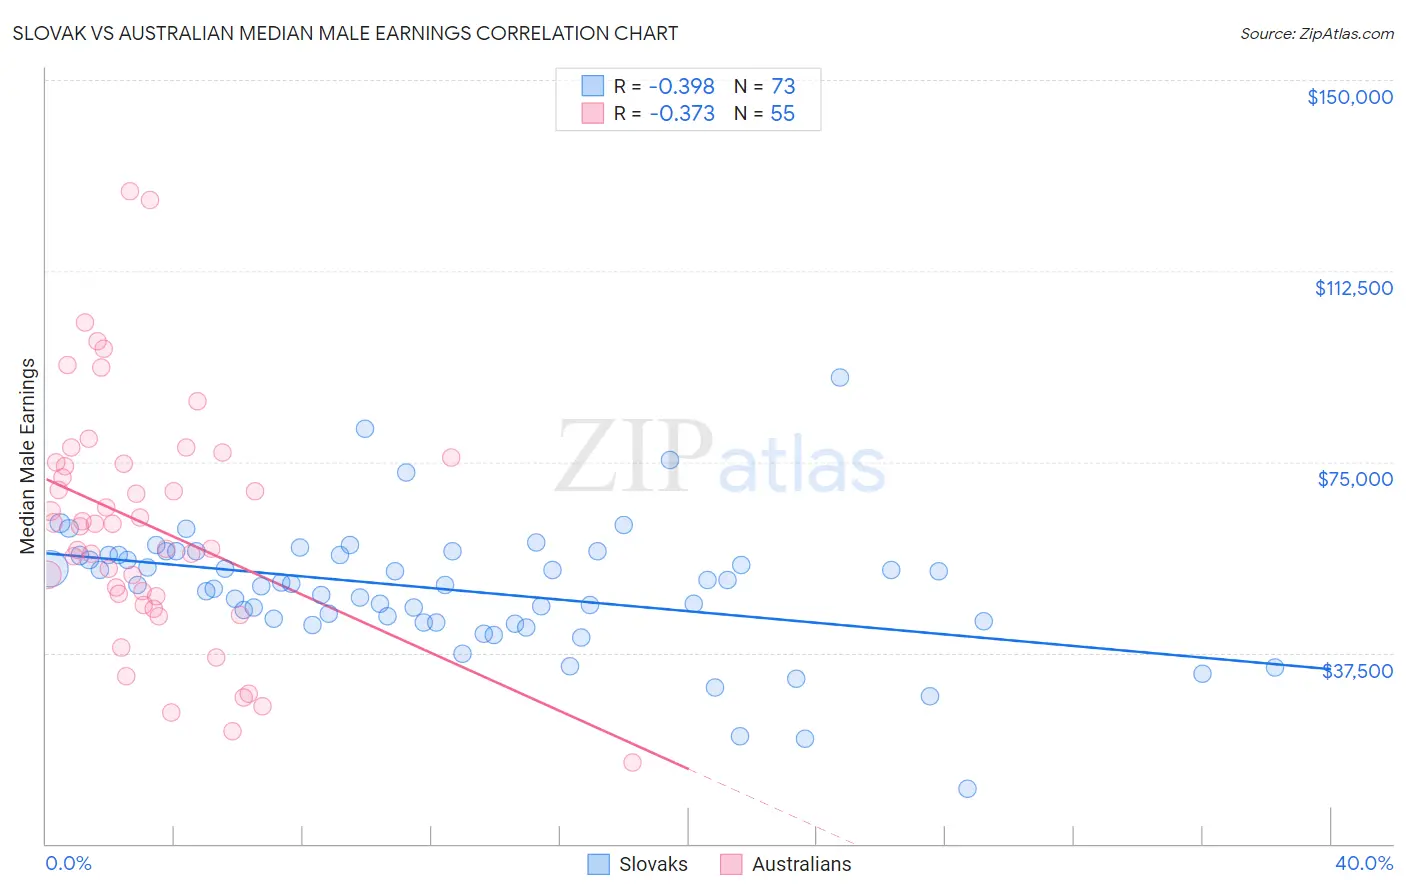
Slovak vs Australian Median Male Earnings Correlation Chart
The statistical analysis conducted on geographies consisting of 397,698,254 people shows a mild negative correlation between the proportion of Slovaks and median male earnings in the United States with a correlation coefficient (R) of -0.398 and weighted average of $56,306. Similarly, the statistical analysis conducted on geographies consisting of 224,135,609 people shows a mild negative correlation between the proportion of Australians and median male earnings in the United States with a correlation coefficient (R) of -0.373 and weighted average of $62,857, a difference of 11.6%.
Median Male Earnings Correlation Summary
| Measurement | Slovak | Australian |
| Minimum | $10,727 | $15,945 |
| Maximum | $91,563 | $128,097 |
| Range | $80,836 | $112,152 |
| Mean | $49,965 | $62,501 |
| Median | $50,933 | $62,813 |
| Interquartile 25% (IQ1) | $43,560 | $48,594 |
| Interquartile 75% (IQ3) | $56,815 | $74,900 |
| Interquartile Range (IQR) | $13,254 | $26,306 |
| Standard Deviation (Sample) | $12,608 | $23,536 |
| Standard Deviation (Population) | $12,522 | $23,321 |
Similar Demographics by Median Male Earnings
Demographics Similar to Slovaks by Median Male Earnings
In terms of median male earnings, the demographic groups most similar to Slovaks are Zimbabwean ($56,302, a difference of 0.010%), Luxembourger ($56,300, a difference of 0.010%), Danish ($56,246, a difference of 0.11%), Ethiopian ($56,243, a difference of 0.11%), and Slavic ($56,390, a difference of 0.15%).
| Demographics | Rating | Rank | Median Male Earnings |
| Portuguese | 89.4 /100 | #131 | Excellent $56,663 |
| Czechs | 88.2 /100 | #132 | Excellent $56,546 |
| Immigrants | Germany | 88.2 /100 | #133 | Excellent $56,542 |
| Moroccans | 87.7 /100 | #134 | Excellent $56,499 |
| Irish | 87.4 /100 | #135 | Excellent $56,464 |
| Immigrants | Saudi Arabia | 87.2 /100 | #136 | Excellent $56,452 |
| Slavs | 86.5 /100 | #137 | Excellent $56,390 |
| Slovaks | 85.5 /100 | #138 | Excellent $56,306 |
| Zimbabweans | 85.5 /100 | #139 | Excellent $56,302 |
| Luxembourgers | 85.5 /100 | #140 | Excellent $56,300 |
| Danes | 84.8 /100 | #141 | Excellent $56,246 |
| Ethiopians | 84.8 /100 | #142 | Excellent $56,243 |
| Sri Lankans | 83.4 /100 | #143 | Excellent $56,136 |
| Immigrants | Uganda | 82.4 /100 | #144 | Excellent $56,064 |
| Norwegians | 80.9 /100 | #145 | Excellent $55,965 |
Demographics Similar to Australians by Median Male Earnings
In terms of median male earnings, the demographic groups most similar to Australians are Immigrants from South Africa ($62,899, a difference of 0.070%), Maltese ($62,953, a difference of 0.15%), Immigrants from Turkey ($62,728, a difference of 0.21%), Immigrants from Greece ($62,689, a difference of 0.27%), and Immigrants from Belarus ($62,658, a difference of 0.32%).
| Demographics | Rating | Rank | Median Male Earnings |
| Immigrants | Lithuania | 100.0 /100 | #33 | Exceptional $63,346 |
| Immigrants | Russia | 100.0 /100 | #34 | Exceptional $63,326 |
| Immigrants | Asia | 100.0 /100 | #35 | Exceptional $63,240 |
| Israelis | 100.0 /100 | #36 | Exceptional $63,228 |
| Immigrants | Sri Lanka | 100.0 /100 | #37 | Exceptional $63,099 |
| Maltese | 100.0 /100 | #38 | Exceptional $62,953 |
| Immigrants | South Africa | 100.0 /100 | #39 | Exceptional $62,899 |
| Australians | 100.0 /100 | #40 | Exceptional $62,857 |
| Immigrants | Turkey | 100.0 /100 | #41 | Exceptional $62,728 |
| Immigrants | Greece | 100.0 /100 | #42 | Exceptional $62,689 |
| Immigrants | Belarus | 100.0 /100 | #43 | Exceptional $62,658 |
| Cambodians | 100.0 /100 | #44 | Exceptional $62,516 |
| Bulgarians | 100.0 /100 | #45 | Exceptional $62,378 |
| Immigrants | Czechoslovakia | 99.9 /100 | #46 | Exceptional $62,217 |
| Immigrants | Austria | 99.9 /100 | #47 | Exceptional $62,164 |