Immigrants from Netherlands vs Australian Median Male Earnings
COMPARE
Immigrants from Netherlands
Australian
Median Male Earnings
Median Male Earnings Comparison
Immigrants from Netherlands
Australians
$61,096
MEDIAN MALE EARNINGS
99.8/ 100
METRIC RATING
59th/ 347
METRIC RANK
$62,857
MEDIAN MALE EARNINGS
100.0/ 100
METRIC RATING
40th/ 347
METRIC RANK
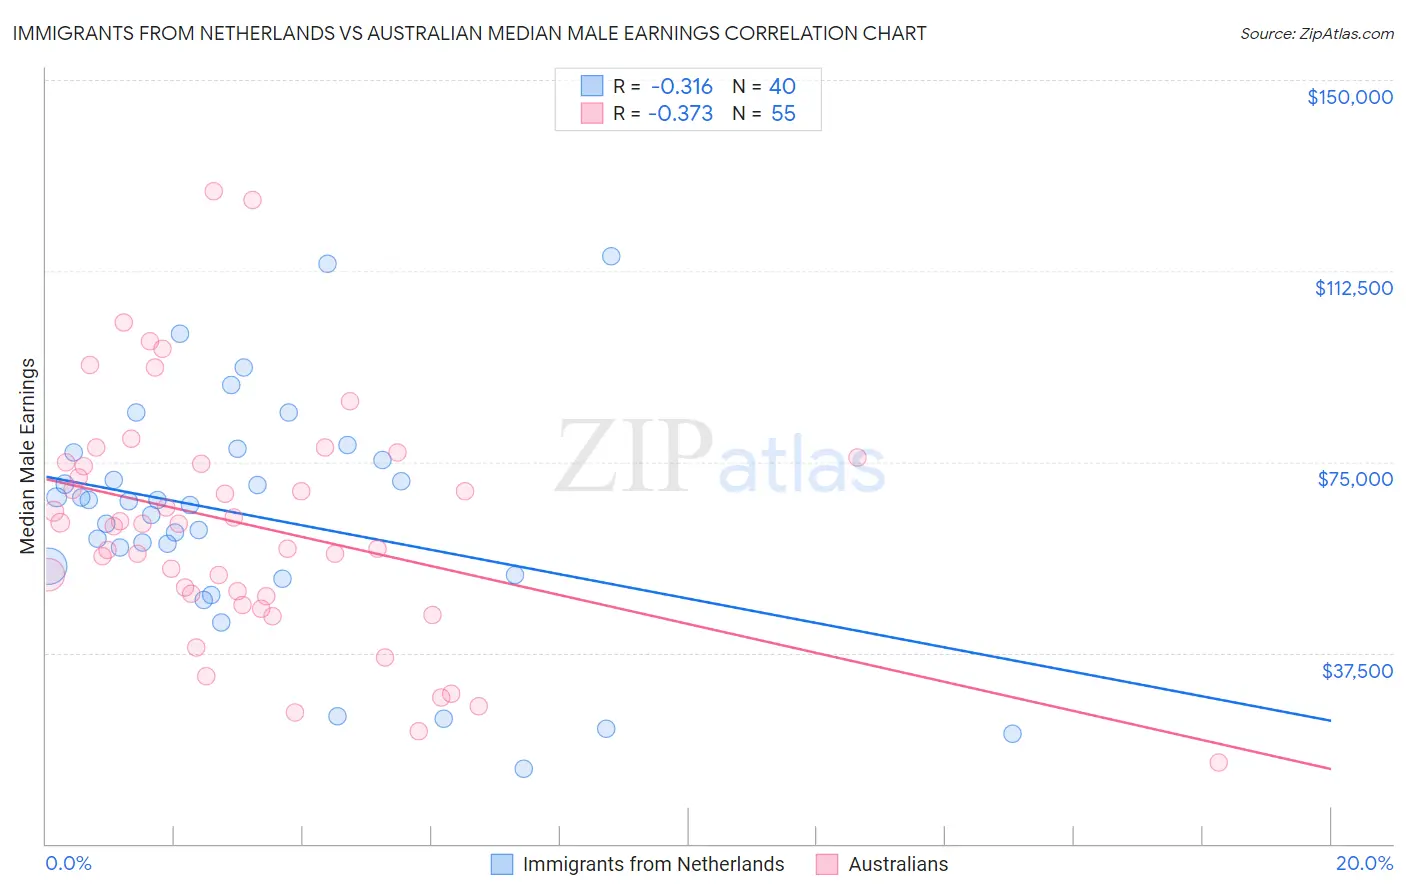
Immigrants from Netherlands vs Australian Median Male Earnings Correlation Chart
The statistical analysis conducted on geographies consisting of 237,827,633 people shows a mild negative correlation between the proportion of Immigrants from Netherlands and median male earnings in the United States with a correlation coefficient (R) of -0.316 and weighted average of $61,096. Similarly, the statistical analysis conducted on geographies consisting of 224,135,609 people shows a mild negative correlation between the proportion of Australians and median male earnings in the United States with a correlation coefficient (R) of -0.373 and weighted average of $62,857, a difference of 2.9%.
Median Male Earnings Correlation Summary
| Measurement | Immigrants from Netherlands | Australian |
| Minimum | $14,643 | $15,945 |
| Maximum | $115,494 | $128,097 |
| Range | $100,851 | $112,152 |
| Mean | $64,341 | $62,501 |
| Median | $66,907 | $62,813 |
| Interquartile 25% (IQ1) | $53,639 | $48,594 |
| Interquartile 75% (IQ3) | $76,092 | $74,900 |
| Interquartile Range (IQR) | $22,453 | $26,306 |
| Standard Deviation (Sample) | $22,767 | $23,536 |
| Standard Deviation (Population) | $22,481 | $23,321 |
Demographics Similar to Immigrants from Netherlands and Australians by Median Male Earnings
In terms of median male earnings, the demographic groups most similar to Immigrants from Netherlands are New Zealander ($61,199, a difference of 0.17%), Immigrants from Scotland ($61,220, a difference of 0.20%), Lithuanian ($61,228, a difference of 0.22%), Greek ($61,242, a difference of 0.24%), and Immigrants from Latvia ($61,422, a difference of 0.53%). Similarly, the demographic groups most similar to Australians are Immigrants from South Africa ($62,899, a difference of 0.070%), Immigrants from Turkey ($62,728, a difference of 0.21%), Immigrants from Greece ($62,689, a difference of 0.27%), Immigrants from Belarus ($62,658, a difference of 0.32%), and Cambodian ($62,516, a difference of 0.55%).
| Demographics | Rating | Rank | Median Male Earnings |
| Immigrants | South Africa | 100.0 /100 | #39 | Exceptional $62,899 |
| Australians | 100.0 /100 | #40 | Exceptional $62,857 |
| Immigrants | Turkey | 100.0 /100 | #41 | Exceptional $62,728 |
| Immigrants | Greece | 100.0 /100 | #42 | Exceptional $62,689 |
| Immigrants | Belarus | 100.0 /100 | #43 | Exceptional $62,658 |
| Cambodians | 100.0 /100 | #44 | Exceptional $62,516 |
| Bulgarians | 100.0 /100 | #45 | Exceptional $62,378 |
| Immigrants | Czechoslovakia | 99.9 /100 | #46 | Exceptional $62,217 |
| Immigrants | Austria | 99.9 /100 | #47 | Exceptional $62,164 |
| Immigrants | Malaysia | 99.9 /100 | #48 | Exceptional $62,121 |
| Immigrants | Europe | 99.9 /100 | #49 | Exceptional $62,057 |
| Bhutanese | 99.9 /100 | #50 | Exceptional $61,759 |
| Estonians | 99.9 /100 | #51 | Exceptional $61,710 |
| Immigrants | Norway | 99.9 /100 | #52 | Exceptional $61,628 |
| South Africans | 99.9 /100 | #53 | Exceptional $61,460 |
| Immigrants | Latvia | 99.9 /100 | #54 | Exceptional $61,422 |
| Greeks | 99.9 /100 | #55 | Exceptional $61,242 |
| Lithuanians | 99.9 /100 | #56 | Exceptional $61,228 |
| Immigrants | Scotland | 99.9 /100 | #57 | Exceptional $61,220 |
| New Zealanders | 99.9 /100 | #58 | Exceptional $61,199 |
| Immigrants | Netherlands | 99.8 /100 | #59 | Exceptional $61,096 |