Jamaican vs Australian Median Male Earnings
COMPARE
Jamaican
Australian
Median Male Earnings
Median Male Earnings Comparison
Jamaicans
Australians
$48,632
MEDIAN MALE EARNINGS
0.3/ 100
METRIC RATING
273rd/ 347
METRIC RANK
$62,857
MEDIAN MALE EARNINGS
100.0/ 100
METRIC RATING
40th/ 347
METRIC RANK
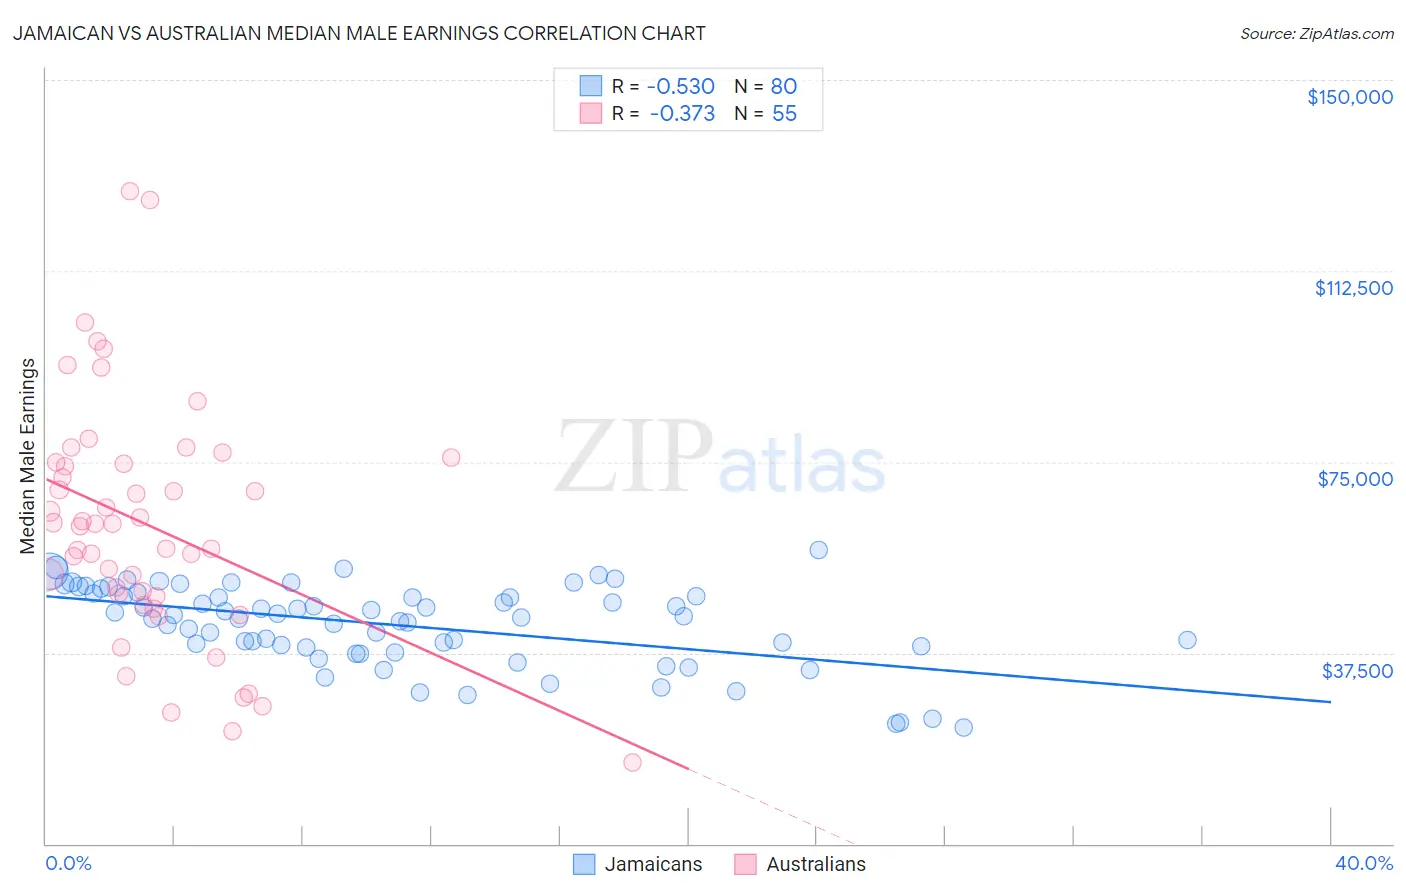
Jamaican vs Australian Median Male Earnings Correlation Chart
The statistical analysis conducted on geographies consisting of 367,962,773 people shows a substantial negative correlation between the proportion of Jamaicans and median male earnings in the United States with a correlation coefficient (R) of -0.530 and weighted average of $48,632. Similarly, the statistical analysis conducted on geographies consisting of 224,135,609 people shows a mild negative correlation between the proportion of Australians and median male earnings in the United States with a correlation coefficient (R) of -0.373 and weighted average of $62,857, a difference of 29.2%.
Median Male Earnings Correlation Summary
| Measurement | Jamaican | Australian |
| Minimum | $22,747 | $15,945 |
| Maximum | $57,769 | $128,097 |
| Range | $35,022 | $112,152 |
| Mean | $42,945 | $62,501 |
| Median | $44,504 | $62,813 |
| Interquartile 25% (IQ1) | $38,662 | $48,594 |
| Interquartile 75% (IQ3) | $48,891 | $74,900 |
| Interquartile Range (IQR) | $10,229 | $26,306 |
| Standard Deviation (Sample) | $7,942 | $23,536 |
| Standard Deviation (Population) | $7,893 | $23,321 |
Similar Demographics by Median Male Earnings
Demographics Similar to Jamaicans by Median Male Earnings
In terms of median male earnings, the demographic groups most similar to Jamaicans are Salvadoran ($48,646, a difference of 0.030%), Cherokee ($48,669, a difference of 0.080%), Colville ($48,516, a difference of 0.24%), Potawatomi ($48,768, a difference of 0.28%), and Immigrants from Somalia ($48,439, a difference of 0.40%).
| Demographics | Rating | Rank | Median Male Earnings |
| Somalis | 0.5 /100 | #266 | Tragic $49,025 |
| Spanish Americans | 0.5 /100 | #267 | Tragic $49,008 |
| Ute | 0.4 /100 | #268 | Tragic $48,899 |
| Tsimshian | 0.4 /100 | #269 | Tragic $48,836 |
| Potawatomi | 0.4 /100 | #270 | Tragic $48,768 |
| Cherokee | 0.3 /100 | #271 | Tragic $48,669 |
| Salvadorans | 0.3 /100 | #272 | Tragic $48,646 |
| Jamaicans | 0.3 /100 | #273 | Tragic $48,632 |
| Colville | 0.3 /100 | #274 | Tragic $48,516 |
| Immigrants | Somalia | 0.3 /100 | #275 | Tragic $48,439 |
| Blackfeet | 0.3 /100 | #276 | Tragic $48,402 |
| Belizeans | 0.2 /100 | #277 | Tragic $48,358 |
| Immigrants | Liberia | 0.2 /100 | #278 | Tragic $48,317 |
| Hmong | 0.2 /100 | #279 | Tragic $48,254 |
| Comanche | 0.2 /100 | #280 | Tragic $48,202 |
Demographics Similar to Australians by Median Male Earnings
In terms of median male earnings, the demographic groups most similar to Australians are Immigrants from South Africa ($62,899, a difference of 0.070%), Maltese ($62,953, a difference of 0.15%), Immigrants from Turkey ($62,728, a difference of 0.21%), Immigrants from Greece ($62,689, a difference of 0.27%), and Immigrants from Belarus ($62,658, a difference of 0.32%).
| Demographics | Rating | Rank | Median Male Earnings |
| Immigrants | Lithuania | 100.0 /100 | #33 | Exceptional $63,346 |
| Immigrants | Russia | 100.0 /100 | #34 | Exceptional $63,326 |
| Immigrants | Asia | 100.0 /100 | #35 | Exceptional $63,240 |
| Israelis | 100.0 /100 | #36 | Exceptional $63,228 |
| Immigrants | Sri Lanka | 100.0 /100 | #37 | Exceptional $63,099 |
| Maltese | 100.0 /100 | #38 | Exceptional $62,953 |
| Immigrants | South Africa | 100.0 /100 | #39 | Exceptional $62,899 |
| Australians | 100.0 /100 | #40 | Exceptional $62,857 |
| Immigrants | Turkey | 100.0 /100 | #41 | Exceptional $62,728 |
| Immigrants | Greece | 100.0 /100 | #42 | Exceptional $62,689 |
| Immigrants | Belarus | 100.0 /100 | #43 | Exceptional $62,658 |
| Cambodians | 100.0 /100 | #44 | Exceptional $62,516 |
| Bulgarians | 100.0 /100 | #45 | Exceptional $62,378 |
| Immigrants | Czechoslovakia | 99.9 /100 | #46 | Exceptional $62,217 |
| Immigrants | Austria | 99.9 /100 | #47 | Exceptional $62,164 |