Black/African American vs Iranian Median Male Earnings
COMPARE
Black/African American
Iranian
Median Male Earnings
Median Male Earnings Comparison
Blacks/African Americans
Iranians
$45,523
MEDIAN MALE EARNINGS
0.0/ 100
METRIC RATING
324th/ 347
METRIC RANK
$70,648
MEDIAN MALE EARNINGS
100.0/ 100
METRIC RATING
6th/ 347
METRIC RANK
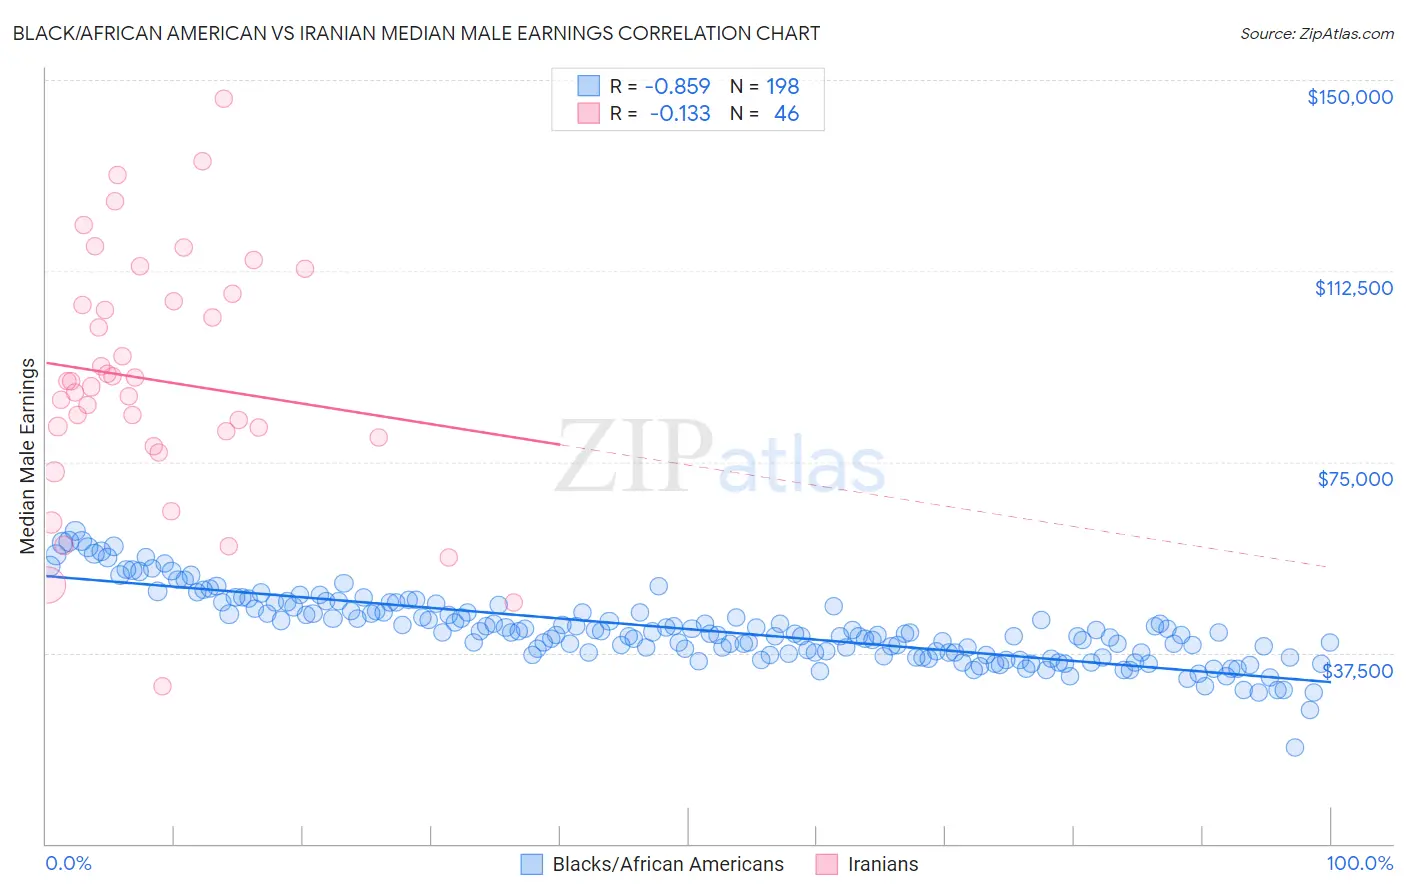
Black/African American vs Iranian Median Male Earnings Correlation Chart
The statistical analysis conducted on geographies consisting of 563,678,879 people shows a very strong negative correlation between the proportion of Blacks/African Americans and median male earnings in the United States with a correlation coefficient (R) of -0.859 and weighted average of $45,523. Similarly, the statistical analysis conducted on geographies consisting of 316,851,455 people shows a poor negative correlation between the proportion of Iranians and median male earnings in the United States with a correlation coefficient (R) of -0.133 and weighted average of $70,648, a difference of 55.2%.
Median Male Earnings Correlation Summary
| Measurement | Black/African American | Iranian |
| Minimum | $18,859 | $30,816 |
| Maximum | $61,488 | $146,250 |
| Range | $42,630 | $115,434 |
| Mean | $42,190 | $91,002 |
| Median | $41,285 | $90,293 |
| Interquartile 25% (IQ1) | $37,450 | $79,904 |
| Interquartile 75% (IQ3) | $46,253 | $106,492 |
| Interquartile Range (IQR) | $8,804 | $26,588 |
| Standard Deviation (Sample) | $6,999 | $24,044 |
| Standard Deviation (Population) | $6,981 | $23,781 |
Similar Demographics by Median Male Earnings
Demographics Similar to Blacks/African Americans by Median Male Earnings
In terms of median male earnings, the demographic groups most similar to Blacks/African Americans are Immigrants from Central America ($45,538, a difference of 0.030%), Sioux ($45,566, a difference of 0.090%), Yuman ($45,446, a difference of 0.17%), Fijian ($45,607, a difference of 0.18%), and Immigrants from Haiti ($45,266, a difference of 0.57%).
| Demographics | Rating | Rank | Median Male Earnings |
| Mexicans | 0.0 /100 | #317 | Tragic $46,147 |
| Cheyenne | 0.0 /100 | #318 | Tragic $46,062 |
| Haitians | 0.0 /100 | #319 | Tragic $45,903 |
| Immigrants | Honduras | 0.0 /100 | #320 | Tragic $45,787 |
| Fijians | 0.0 /100 | #321 | Tragic $45,607 |
| Sioux | 0.0 /100 | #322 | Tragic $45,566 |
| Immigrants | Central America | 0.0 /100 | #323 | Tragic $45,538 |
| Blacks/African Americans | 0.0 /100 | #324 | Tragic $45,523 |
| Yuman | 0.0 /100 | #325 | Tragic $45,446 |
| Immigrants | Haiti | 0.0 /100 | #326 | Tragic $45,266 |
| Immigrants | Bahamas | 0.0 /100 | #327 | Tragic $45,176 |
| Kiowa | 0.0 /100 | #328 | Tragic $45,094 |
| Yakama | 0.0 /100 | #329 | Tragic $45,002 |
| Immigrants | Mexico | 0.0 /100 | #330 | Tragic $44,960 |
| Natives/Alaskans | 0.0 /100 | #331 | Tragic $44,775 |
Demographics Similar to Iranians by Median Male Earnings
In terms of median male earnings, the demographic groups most similar to Iranians are Immigrants from Hong Kong ($70,146, a difference of 0.72%), Immigrants from Singapore ($71,348, a difference of 0.99%), Immigrants from Iran ($69,284, a difference of 2.0%), Thai ($72,135, a difference of 2.1%), and Immigrants from South Central Asia ($68,960, a difference of 2.5%).
| Demographics | Rating | Rank | Median Male Earnings |
| Filipinos | 100.0 /100 | #1 | Exceptional $74,224 |
| Immigrants | India | 100.0 /100 | #2 | Exceptional $74,207 |
| Immigrants | Taiwan | 100.0 /100 | #3 | Exceptional $74,031 |
| Thais | 100.0 /100 | #4 | Exceptional $72,135 |
| Immigrants | Singapore | 100.0 /100 | #5 | Exceptional $71,348 |
| Iranians | 100.0 /100 | #6 | Exceptional $70,648 |
| Immigrants | Hong Kong | 100.0 /100 | #7 | Exceptional $70,146 |
| Immigrants | Iran | 100.0 /100 | #8 | Exceptional $69,284 |
| Immigrants | South Central Asia | 100.0 /100 | #9 | Exceptional $68,960 |
| Immigrants | Israel | 100.0 /100 | #10 | Exceptional $68,716 |
| Immigrants | Ireland | 100.0 /100 | #11 | Exceptional $67,698 |
| Immigrants | Australia | 100.0 /100 | #12 | Exceptional $67,634 |
| Immigrants | China | 100.0 /100 | #13 | Exceptional $67,353 |
| Okinawans | 100.0 /100 | #14 | Exceptional $67,232 |
| Immigrants | Eastern Asia | 100.0 /100 | #15 | Exceptional $66,903 |