Black/African American vs Immigrants from Australia Median Male Earnings
COMPARE
Black/African American
Immigrants from Australia
Median Male Earnings
Median Male Earnings Comparison
Blacks/African Americans
Immigrants from Australia
$45,523
MEDIAN MALE EARNINGS
0.0/ 100
METRIC RATING
324th/ 347
METRIC RANK
$67,634
MEDIAN MALE EARNINGS
100.0/ 100
METRIC RATING
12th/ 347
METRIC RANK
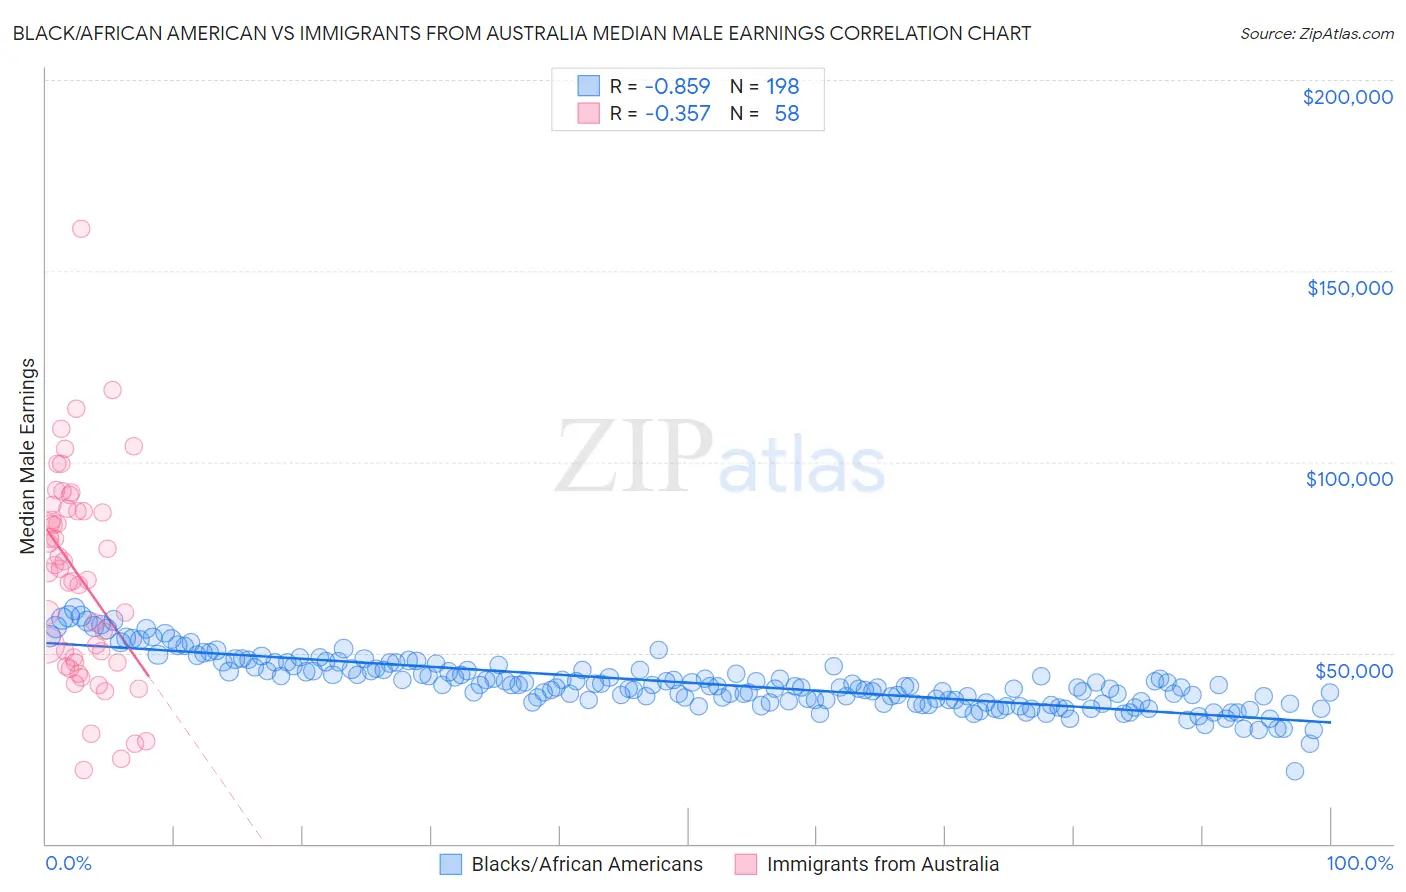
Black/African American vs Immigrants from Australia Median Male Earnings Correlation Chart
The statistical analysis conducted on geographies consisting of 563,678,879 people shows a very strong negative correlation between the proportion of Blacks/African Americans and median male earnings in the United States with a correlation coefficient (R) of -0.859 and weighted average of $45,523. Similarly, the statistical analysis conducted on geographies consisting of 227,162,363 people shows a mild negative correlation between the proportion of Immigrants from Australia and median male earnings in the United States with a correlation coefficient (R) of -0.357 and weighted average of $67,634, a difference of 48.6%.
Median Male Earnings Correlation Summary
| Measurement | Black/African American | Immigrants from Australia |
| Minimum | $18,859 | $19,341 |
| Maximum | $61,488 | $160,989 |
| Range | $42,630 | $141,648 |
| Mean | $42,190 | $69,957 |
| Median | $41,285 | $71,553 |
| Interquartile 25% (IQ1) | $37,450 | $47,501 |
| Interquartile 75% (IQ3) | $46,253 | $87,155 |
| Interquartile Range (IQR) | $8,804 | $39,654 |
| Standard Deviation (Sample) | $6,999 | $27,266 |
| Standard Deviation (Population) | $6,981 | $27,029 |
Similar Demographics by Median Male Earnings
Demographics Similar to Blacks/African Americans by Median Male Earnings
In terms of median male earnings, the demographic groups most similar to Blacks/African Americans are Immigrants from Central America ($45,538, a difference of 0.030%), Sioux ($45,566, a difference of 0.090%), Yuman ($45,446, a difference of 0.17%), Fijian ($45,607, a difference of 0.18%), and Immigrants from Haiti ($45,266, a difference of 0.57%).
| Demographics | Rating | Rank | Median Male Earnings |
| Mexicans | 0.0 /100 | #317 | Tragic $46,147 |
| Cheyenne | 0.0 /100 | #318 | Tragic $46,062 |
| Haitians | 0.0 /100 | #319 | Tragic $45,903 |
| Immigrants | Honduras | 0.0 /100 | #320 | Tragic $45,787 |
| Fijians | 0.0 /100 | #321 | Tragic $45,607 |
| Sioux | 0.0 /100 | #322 | Tragic $45,566 |
| Immigrants | Central America | 0.0 /100 | #323 | Tragic $45,538 |
| Blacks/African Americans | 0.0 /100 | #324 | Tragic $45,523 |
| Yuman | 0.0 /100 | #325 | Tragic $45,446 |
| Immigrants | Haiti | 0.0 /100 | #326 | Tragic $45,266 |
| Immigrants | Bahamas | 0.0 /100 | #327 | Tragic $45,176 |
| Kiowa | 0.0 /100 | #328 | Tragic $45,094 |
| Yakama | 0.0 /100 | #329 | Tragic $45,002 |
| Immigrants | Mexico | 0.0 /100 | #330 | Tragic $44,960 |
| Natives/Alaskans | 0.0 /100 | #331 | Tragic $44,775 |
Demographics Similar to Immigrants from Australia by Median Male Earnings
In terms of median male earnings, the demographic groups most similar to Immigrants from Australia are Immigrants from Ireland ($67,698, a difference of 0.090%), Immigrants from China ($67,353, a difference of 0.42%), Okinawan ($67,232, a difference of 0.60%), Immigrants from Eastern Asia ($66,903, a difference of 1.1%), and Immigrants from Israel ($68,716, a difference of 1.6%).
| Demographics | Rating | Rank | Median Male Earnings |
| Immigrants | Singapore | 100.0 /100 | #5 | Exceptional $71,348 |
| Iranians | 100.0 /100 | #6 | Exceptional $70,648 |
| Immigrants | Hong Kong | 100.0 /100 | #7 | Exceptional $70,146 |
| Immigrants | Iran | 100.0 /100 | #8 | Exceptional $69,284 |
| Immigrants | South Central Asia | 100.0 /100 | #9 | Exceptional $68,960 |
| Immigrants | Israel | 100.0 /100 | #10 | Exceptional $68,716 |
| Immigrants | Ireland | 100.0 /100 | #11 | Exceptional $67,698 |
| Immigrants | Australia | 100.0 /100 | #12 | Exceptional $67,634 |
| Immigrants | China | 100.0 /100 | #13 | Exceptional $67,353 |
| Okinawans | 100.0 /100 | #14 | Exceptional $67,232 |
| Immigrants | Eastern Asia | 100.0 /100 | #15 | Exceptional $66,903 |
| Eastern Europeans | 100.0 /100 | #16 | Exceptional $66,472 |
| Immigrants | Belgium | 100.0 /100 | #17 | Exceptional $66,125 |
| Indians (Asian) | 100.0 /100 | #18 | Exceptional $66,078 |
| Cypriots | 100.0 /100 | #19 | Exceptional $65,549 |