Black/African American vs Iranian In Labor Force | Age 16-19
COMPARE
Black/African American
Iranian
In Labor Force | Age 16-19
In Labor Force | Age 16-19 Comparison
Blacks/African Americans
Iranians
36.5%
IN LABOR FORCE | AGE 16-19
45.1/ 100
METRIC RATING
178th/ 347
METRIC RANK
33.0%
IN LABOR FORCE | AGE 16-19
0.0/ 100
METRIC RATING
298th/ 347
METRIC RANK
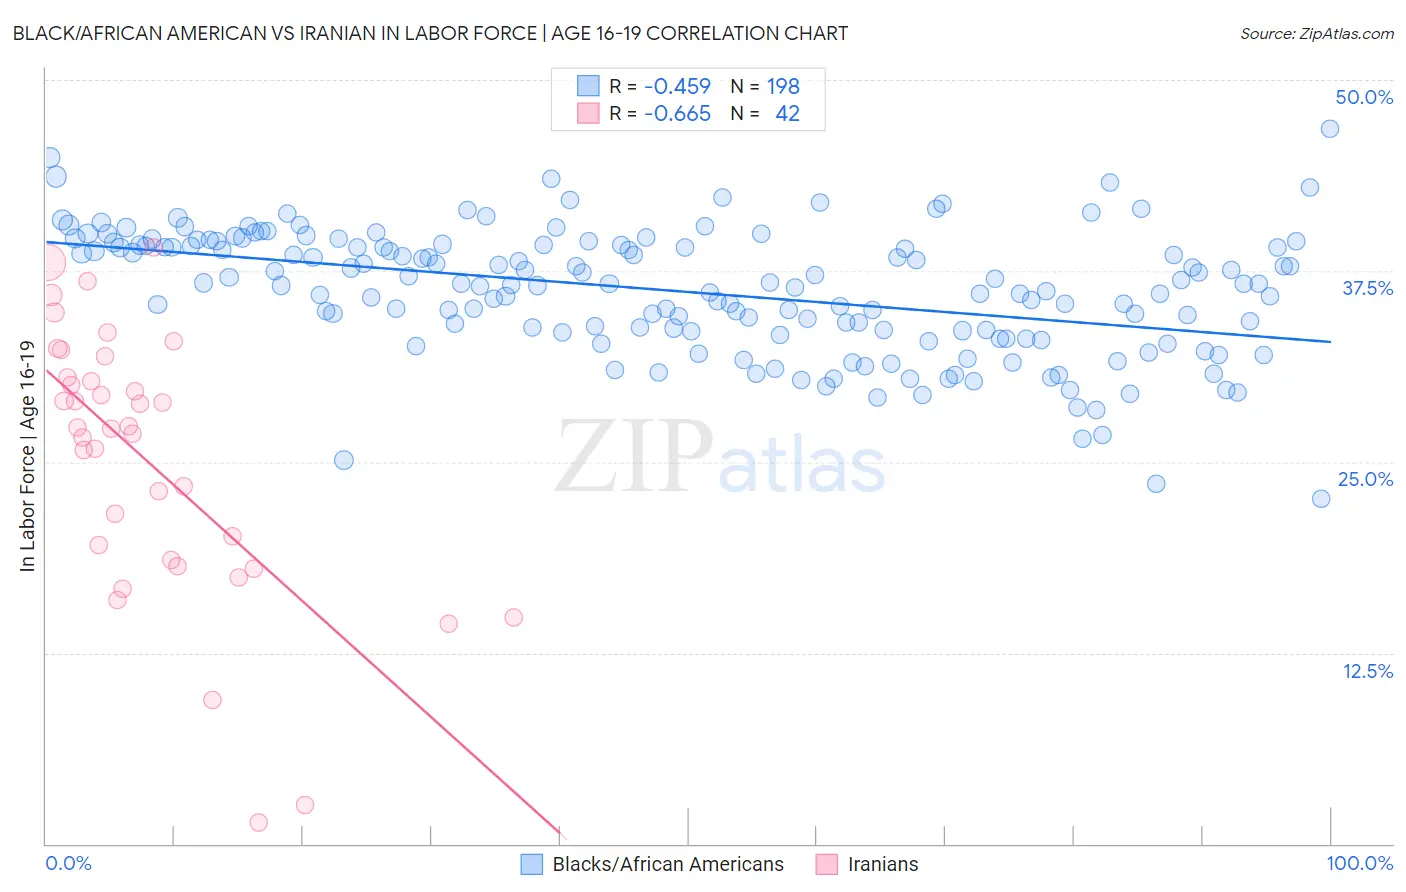
Black/African American vs Iranian In Labor Force | Age 16-19 Correlation Chart
The statistical analysis conducted on geographies consisting of 562,399,773 people shows a moderate negative correlation between the proportion of Blacks/African Americans and labor force participation rate among population between the ages 16 and 19 in the United States with a correlation coefficient (R) of -0.459 and weighted average of 36.5%. Similarly, the statistical analysis conducted on geographies consisting of 316,490,712 people shows a significant negative correlation between the proportion of Iranians and labor force participation rate among population between the ages 16 and 19 in the United States with a correlation coefficient (R) of -0.665 and weighted average of 33.0%, a difference of 10.5%.
In Labor Force | Age 16-19 Correlation Summary
| Measurement | Black/African American | Iranian |
| Minimum | 22.6% | 1.4% |
| Maximum | 46.8% | 39.0% |
| Range | 24.2% | 37.6% |
| Mean | 36.1% | 25.1% |
| Median | 36.6% | 27.2% |
| Interquartile 25% (IQ1) | 33.5% | 18.6% |
| Interquartile 75% (IQ3) | 39.2% | 30.5% |
| Interquartile Range (IQR) | 5.7% | 11.9% |
| Standard Deviation (Sample) | 4.1% | 8.8% |
| Standard Deviation (Population) | 4.1% | 8.7% |
Similar Demographics by In Labor Force | Age 16-19
Demographics Similar to Blacks/African Americans by In Labor Force | Age 16-19
In terms of in labor force | age 16-19, the demographic groups most similar to Blacks/African Americans are Immigrants from Northern Europe (36.5%, a difference of 0.080%), Immigrants from Southern Europe (36.4%, a difference of 0.090%), Albanian (36.5%, a difference of 0.19%), Native/Alaskan (36.6%, a difference of 0.20%), and Immigrants from Morocco (36.4%, a difference of 0.21%).
| Demographics | Rating | Rank | In Labor Force | Age 16-19 |
| Immigrants | Cambodia | 58.4 /100 | #171 | Average 36.7% |
| South Africans | 58.3 /100 | #172 | Average 36.7% |
| Russians | 57.5 /100 | #173 | Average 36.7% |
| Immigrants | Czechoslovakia | 50.0 /100 | #174 | Average 36.6% |
| Natives/Alaskans | 49.0 /100 | #175 | Average 36.6% |
| Albanians | 48.8 /100 | #176 | Average 36.5% |
| Immigrants | Northern Europe | 46.6 /100 | #177 | Average 36.5% |
| Blacks/African Americans | 45.1 /100 | #178 | Average 36.5% |
| Immigrants | Southern Europe | 43.3 /100 | #179 | Average 36.4% |
| Immigrants | Morocco | 41.1 /100 | #180 | Average 36.4% |
| Jordanians | 39.6 /100 | #181 | Fair 36.4% |
| Immigrants | Italy | 39.1 /100 | #182 | Fair 36.4% |
| Eastern Europeans | 38.8 /100 | #183 | Fair 36.4% |
| Costa Ricans | 36.1 /100 | #184 | Fair 36.3% |
| Bhutanese | 35.3 /100 | #185 | Fair 36.3% |
Demographics Similar to Iranians by In Labor Force | Age 16-19
In terms of in labor force | age 16-19, the demographic groups most similar to Iranians are Armenian (32.9%, a difference of 0.24%), Immigrants from Argentina (32.9%, a difference of 0.40%), Immigrants from Haiti (33.2%, a difference of 0.51%), Jamaican (33.2%, a difference of 0.60%), and Okinawan (32.8%, a difference of 0.63%).
| Demographics | Rating | Rank | In Labor Force | Age 16-19 |
| Immigrants | Belarus | 0.1 /100 | #291 | Tragic 33.4% |
| Haitians | 0.1 /100 | #292 | Tragic 33.4% |
| Immigrants | South America | 0.1 /100 | #293 | Tragic 33.3% |
| Argentineans | 0.1 /100 | #294 | Tragic 33.3% |
| Yup'ik | 0.1 /100 | #295 | Tragic 33.3% |
| Jamaicans | 0.1 /100 | #296 | Tragic 33.2% |
| Immigrants | Haiti | 0.1 /100 | #297 | Tragic 33.2% |
| Iranians | 0.0 /100 | #298 | Tragic 33.0% |
| Armenians | 0.0 /100 | #299 | Tragic 32.9% |
| Immigrants | Argentina | 0.0 /100 | #300 | Tragic 32.9% |
| Okinawans | 0.0 /100 | #301 | Tragic 32.8% |
| Belizeans | 0.0 /100 | #302 | Tragic 32.8% |
| Immigrants | Dominica | 0.0 /100 | #303 | Tragic 32.5% |
| Israelis | 0.0 /100 | #304 | Tragic 32.4% |
| Nicaraguans | 0.0 /100 | #305 | Tragic 32.4% |