Black/African American vs Iranian Divorced or Separated
COMPARE
Black/African American
Iranian
Divorced or Separated
Divorced or Separated Comparison
Blacks/African Americans
Iranians
13.6%
DIVORCED OR SEPARATED
0.0/ 100
METRIC RATING
331st/ 347
METRIC RANK
10.8%
DIVORCED OR SEPARATED
100.0/ 100
METRIC RATING
25th/ 347
METRIC RANK
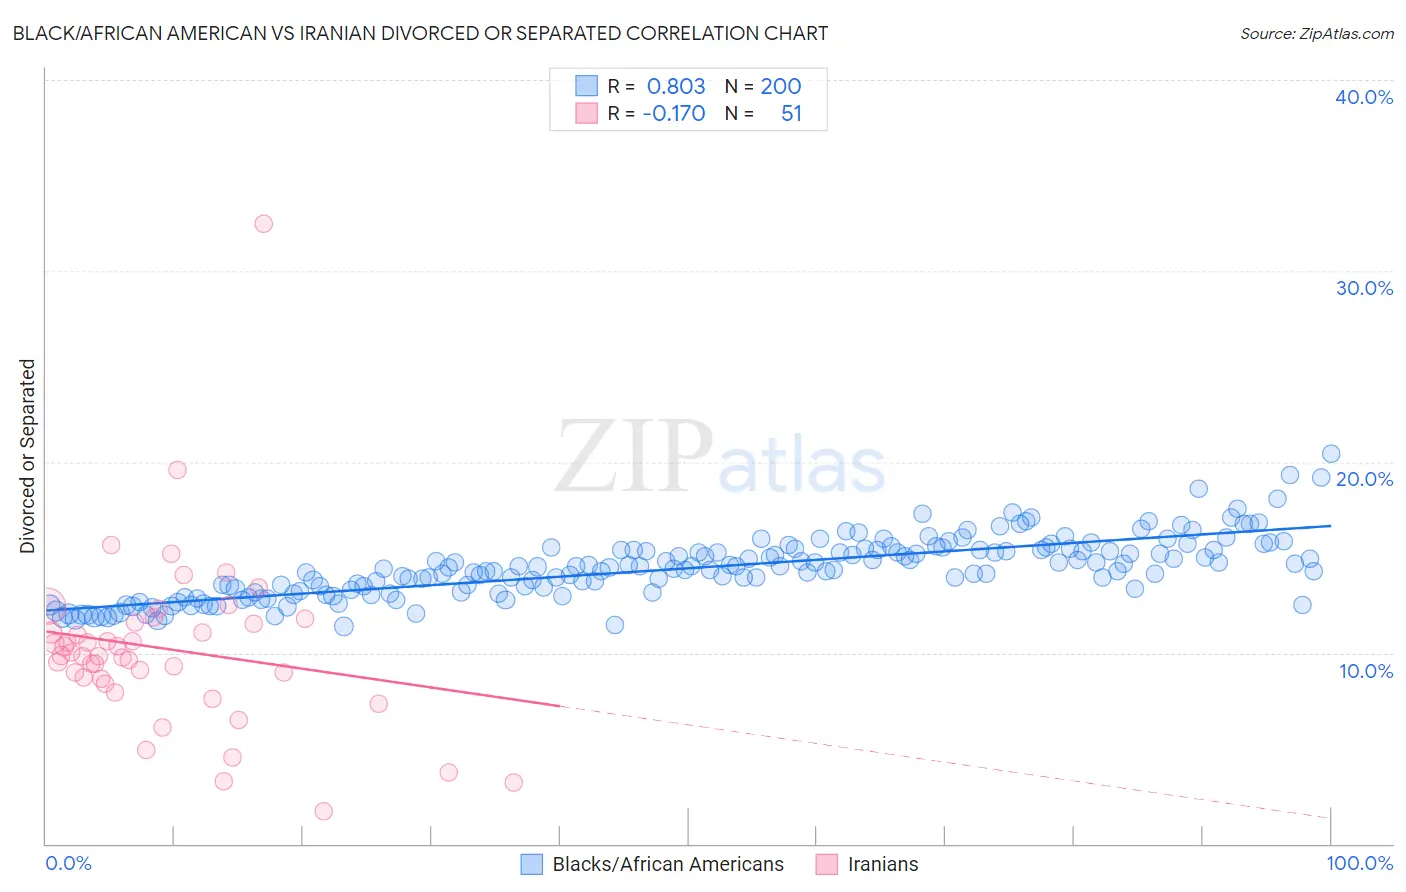
Black/African American vs Iranian Divorced or Separated Correlation Chart
The statistical analysis conducted on geographies consisting of 565,552,203 people shows a very strong positive correlation between the proportion of Blacks/African Americans and percentage of population currently divorced or separated in the United States with a correlation coefficient (R) of 0.803 and weighted average of 13.6%. Similarly, the statistical analysis conducted on geographies consisting of 316,734,230 people shows a poor negative correlation between the proportion of Iranians and percentage of population currently divorced or separated in the United States with a correlation coefficient (R) of -0.170 and weighted average of 10.8%, a difference of 26.1%.
Divorced or Separated Correlation Summary
| Measurement | Black/African American | Iranian |
| Minimum | 11.4% | 1.7% |
| Maximum | 20.4% | 32.5% |
| Range | 9.1% | 30.8% |
| Mean | 14.4% | 10.2% |
| Median | 14.4% | 9.9% |
| Interquartile 25% (IQ1) | 13.2% | 8.6% |
| Interquartile 75% (IQ3) | 15.4% | 11.6% |
| Interquartile Range (IQR) | 2.2% | 2.9% |
| Standard Deviation (Sample) | 1.6% | 4.6% |
| Standard Deviation (Population) | 1.6% | 4.5% |
Similar Demographics by Divorced or Separated
Demographics Similar to Blacks/African Americans by Divorced or Separated
In terms of divorced or separated, the demographic groups most similar to Blacks/African Americans are Paiute (13.6%, a difference of 0.13%), Houma (13.6%, a difference of 0.24%), Immigrants from Caribbean (13.6%, a difference of 0.39%), Cherokee (13.7%, a difference of 0.76%), and Comanche (13.5%, a difference of 0.77%).
| Demographics | Rating | Rank | Divorced or Separated |
| Osage | 0.0 /100 | #324 | Tragic 13.4% |
| Potawatomi | 0.0 /100 | #325 | Tragic 13.5% |
| Immigrants | Congo | 0.0 /100 | #326 | Tragic 13.5% |
| Comanche | 0.0 /100 | #327 | Tragic 13.5% |
| Immigrants | Caribbean | 0.0 /100 | #328 | Tragic 13.6% |
| Houma | 0.0 /100 | #329 | Tragic 13.6% |
| Paiute | 0.0 /100 | #330 | Tragic 13.6% |
| Blacks/African Americans | 0.0 /100 | #331 | Tragic 13.6% |
| Cherokee | 0.0 /100 | #332 | Tragic 13.7% |
| Puerto Ricans | 0.0 /100 | #333 | Tragic 13.9% |
| Immigrants | Bahamas | 0.0 /100 | #334 | Tragic 13.9% |
| Dutch West Indians | 0.0 /100 | #335 | Tragic 14.0% |
| Shoshone | 0.0 /100 | #336 | Tragic 14.0% |
| Crow | 0.0 /100 | #337 | Tragic 14.1% |
| Choctaw | 0.0 /100 | #338 | Tragic 14.1% |
Demographics Similar to Iranians by Divorced or Separated
In terms of divorced or separated, the demographic groups most similar to Iranians are Immigrants from Sri Lanka (10.8%, a difference of 0.050%), Immigrants from Pakistan (10.8%, a difference of 0.24%), Vietnamese (10.8%, a difference of 0.42%), Immigrants from Asia (10.7%, a difference of 0.68%), and Burmese (10.7%, a difference of 0.86%).
| Demographics | Rating | Rank | Divorced or Separated |
| Immigrants | Iran | 100.0 /100 | #18 | Exceptional 10.6% |
| Asians | 100.0 /100 | #19 | Exceptional 10.6% |
| Burmese | 100.0 /100 | #20 | Exceptional 10.7% |
| Immigrants | Asia | 100.0 /100 | #21 | Exceptional 10.7% |
| Vietnamese | 100.0 /100 | #22 | Exceptional 10.8% |
| Immigrants | Pakistan | 100.0 /100 | #23 | Exceptional 10.8% |
| Immigrants | Sri Lanka | 100.0 /100 | #24 | Exceptional 10.8% |
| Iranians | 100.0 /100 | #25 | Exceptional 10.8% |
| Immigrants | Indonesia | 100.0 /100 | #26 | Exceptional 10.9% |
| Immigrants | Bangladesh | 100.0 /100 | #27 | Exceptional 11.0% |
| Immigrants | Malaysia | 100.0 /100 | #28 | Exceptional 11.0% |
| Armenians | 100.0 /100 | #29 | Exceptional 11.0% |
| Immigrants | Ireland | 100.0 /100 | #30 | Exceptional 11.0% |
| Mongolians | 100.0 /100 | #31 | Exceptional 11.1% |
| Tongans | 100.0 /100 | #32 | Exceptional 11.1% |