Immigrants from Cameroon vs Iranian Median Male Earnings
COMPARE
Immigrants from Cameroon
Iranian
Median Male Earnings
Median Male Earnings Comparison
Immigrants from Cameroon
Iranians
$52,119
MEDIAN MALE EARNINGS
8.9/ 100
METRIC RATING
215th/ 347
METRIC RANK
$70,648
MEDIAN MALE EARNINGS
100.0/ 100
METRIC RATING
6th/ 347
METRIC RANK
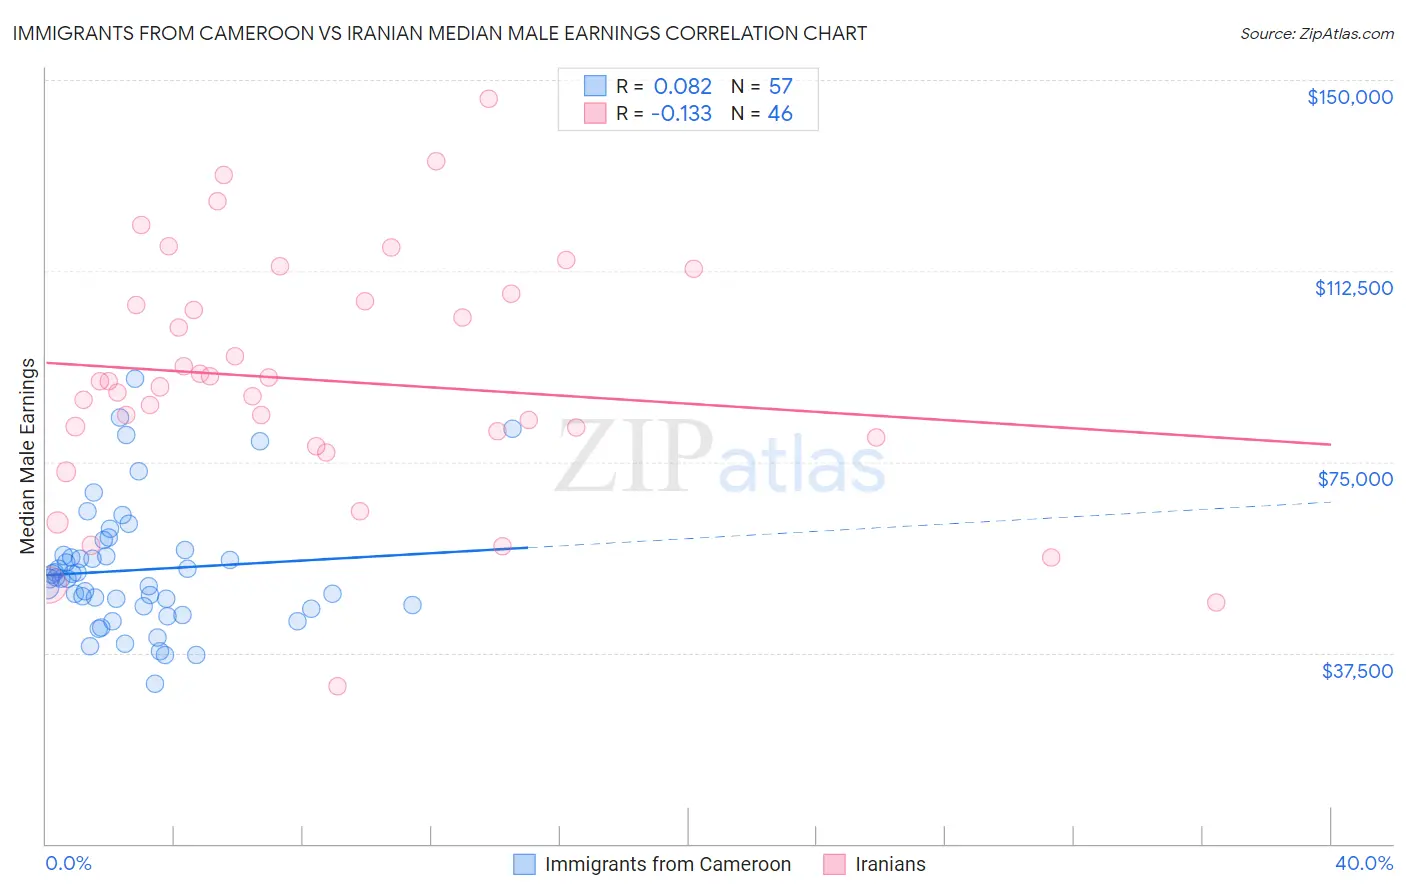
Immigrants from Cameroon vs Iranian Median Male Earnings Correlation Chart
The statistical analysis conducted on geographies consisting of 130,759,044 people shows a slight positive correlation between the proportion of Immigrants from Cameroon and median male earnings in the United States with a correlation coefficient (R) of 0.082 and weighted average of $52,119. Similarly, the statistical analysis conducted on geographies consisting of 316,851,455 people shows a poor negative correlation between the proportion of Iranians and median male earnings in the United States with a correlation coefficient (R) of -0.133 and weighted average of $70,648, a difference of 35.5%.
Median Male Earnings Correlation Summary
| Measurement | Immigrants from Cameroon | Iranian |
| Minimum | $31,418 | $30,816 |
| Maximum | $91,296 | $146,250 |
| Range | $59,878 | $115,434 |
| Mean | $53,781 | $91,002 |
| Median | $52,076 | $90,293 |
| Interquartile 25% (IQ1) | $46,476 | $79,904 |
| Interquartile 75% (IQ3) | $57,139 | $106,492 |
| Interquartile Range (IQR) | $10,663 | $26,588 |
| Standard Deviation (Sample) | $12,326 | $24,044 |
| Standard Deviation (Population) | $12,218 | $23,781 |
Similar Demographics by Median Male Earnings
Demographics Similar to Immigrants from Cameroon by Median Male Earnings
In terms of median male earnings, the demographic groups most similar to Immigrants from Cameroon are Nonimmigrants ($52,170, a difference of 0.10%), Immigrants from Venezuela ($52,041, a difference of 0.15%), Nigerian ($52,039, a difference of 0.15%), Immigrants from Panama ($51,962, a difference of 0.30%), and Native Hawaiian ($52,306, a difference of 0.36%).
| Demographics | Rating | Rank | Median Male Earnings |
| Venezuelans | 12.5 /100 | #208 | Poor $52,510 |
| Bermudans | 12.1 /100 | #209 | Poor $52,465 |
| Delaware | 11.5 /100 | #210 | Poor $52,412 |
| Tlingit-Haida | 11.5 /100 | #211 | Poor $52,409 |
| Cajuns | 10.7 /100 | #212 | Poor $52,325 |
| Native Hawaiians | 10.5 /100 | #213 | Poor $52,306 |
| Immigrants | Nonimmigrants | 9.3 /100 | #214 | Tragic $52,170 |
| Immigrants | Cameroon | 8.9 /100 | #215 | Tragic $52,119 |
| Immigrants | Venezuela | 8.3 /100 | #216 | Tragic $52,041 |
| Nigerians | 8.3 /100 | #217 | Tragic $52,039 |
| Immigrants | Panama | 7.7 /100 | #218 | Tragic $51,962 |
| Immigrants | Ghana | 6.9 /100 | #219 | Tragic $51,836 |
| Immigrants | Armenia | 6.6 /100 | #220 | Tragic $51,793 |
| Immigrants | Senegal | 5.8 /100 | #221 | Tragic $51,647 |
| Immigrants | Bangladesh | 5.8 /100 | #222 | Tragic $51,642 |
Demographics Similar to Iranians by Median Male Earnings
In terms of median male earnings, the demographic groups most similar to Iranians are Immigrants from Hong Kong ($70,146, a difference of 0.72%), Immigrants from Singapore ($71,348, a difference of 0.99%), Immigrants from Iran ($69,284, a difference of 2.0%), Thai ($72,135, a difference of 2.1%), and Immigrants from South Central Asia ($68,960, a difference of 2.5%).
| Demographics | Rating | Rank | Median Male Earnings |
| Filipinos | 100.0 /100 | #1 | Exceptional $74,224 |
| Immigrants | India | 100.0 /100 | #2 | Exceptional $74,207 |
| Immigrants | Taiwan | 100.0 /100 | #3 | Exceptional $74,031 |
| Thais | 100.0 /100 | #4 | Exceptional $72,135 |
| Immigrants | Singapore | 100.0 /100 | #5 | Exceptional $71,348 |
| Iranians | 100.0 /100 | #6 | Exceptional $70,648 |
| Immigrants | Hong Kong | 100.0 /100 | #7 | Exceptional $70,146 |
| Immigrants | Iran | 100.0 /100 | #8 | Exceptional $69,284 |
| Immigrants | South Central Asia | 100.0 /100 | #9 | Exceptional $68,960 |
| Immigrants | Israel | 100.0 /100 | #10 | Exceptional $68,716 |
| Immigrants | Ireland | 100.0 /100 | #11 | Exceptional $67,698 |
| Immigrants | Australia | 100.0 /100 | #12 | Exceptional $67,634 |
| Immigrants | China | 100.0 /100 | #13 | Exceptional $67,353 |
| Okinawans | 100.0 /100 | #14 | Exceptional $67,232 |
| Immigrants | Eastern Asia | 100.0 /100 | #15 | Exceptional $66,903 |