Black/African American vs Immigrants from England Median Male Earnings
COMPARE
Black/African American
Immigrants from England
Median Male Earnings
Median Male Earnings Comparison
Blacks/African Americans
Immigrants from England
$45,523
MEDIAN MALE EARNINGS
0.0/ 100
METRIC RATING
324th/ 347
METRIC RANK
$59,527
MEDIAN MALE EARNINGS
99.3/ 100
METRIC RATING
86th/ 347
METRIC RANK
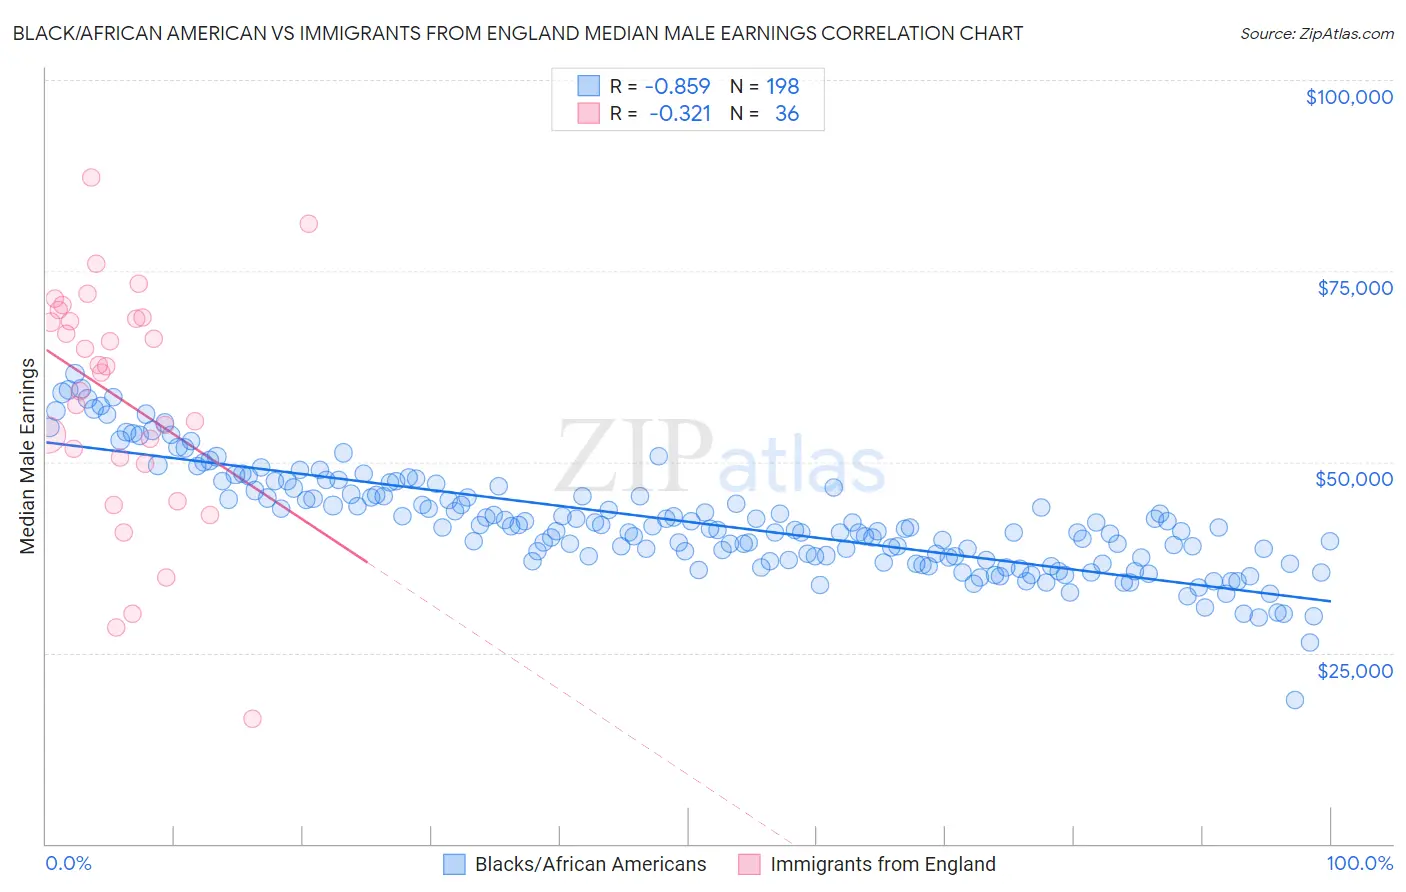
Black/African American vs Immigrants from England Median Male Earnings Correlation Chart
The statistical analysis conducted on geographies consisting of 563,678,879 people shows a very strong negative correlation between the proportion of Blacks/African Americans and median male earnings in the United States with a correlation coefficient (R) of -0.859 and weighted average of $45,523. Similarly, the statistical analysis conducted on geographies consisting of 391,689,688 people shows a mild negative correlation between the proportion of Immigrants from England and median male earnings in the United States with a correlation coefficient (R) of -0.321 and weighted average of $59,527, a difference of 30.8%.
Median Male Earnings Correlation Summary
| Measurement | Black/African American | Immigrants from England |
| Minimum | $18,859 | $16,326 |
| Maximum | $61,488 | $87,186 |
| Range | $42,630 | $70,860 |
| Mean | $42,190 | $58,179 |
| Median | $41,285 | $62,084 |
| Interquartile 25% (IQ1) | $37,450 | $50,179 |
| Interquartile 75% (IQ3) | $46,253 | $68,837 |
| Interquartile Range (IQR) | $8,804 | $18,658 |
| Standard Deviation (Sample) | $6,999 | $15,499 |
| Standard Deviation (Population) | $6,981 | $15,282 |
Similar Demographics by Median Male Earnings
Demographics Similar to Blacks/African Americans by Median Male Earnings
In terms of median male earnings, the demographic groups most similar to Blacks/African Americans are Immigrants from Central America ($45,538, a difference of 0.030%), Sioux ($45,566, a difference of 0.090%), Yuman ($45,446, a difference of 0.17%), Fijian ($45,607, a difference of 0.18%), and Immigrants from Haiti ($45,266, a difference of 0.57%).
| Demographics | Rating | Rank | Median Male Earnings |
| Mexicans | 0.0 /100 | #317 | Tragic $46,147 |
| Cheyenne | 0.0 /100 | #318 | Tragic $46,062 |
| Haitians | 0.0 /100 | #319 | Tragic $45,903 |
| Immigrants | Honduras | 0.0 /100 | #320 | Tragic $45,787 |
| Fijians | 0.0 /100 | #321 | Tragic $45,607 |
| Sioux | 0.0 /100 | #322 | Tragic $45,566 |
| Immigrants | Central America | 0.0 /100 | #323 | Tragic $45,538 |
| Blacks/African Americans | 0.0 /100 | #324 | Tragic $45,523 |
| Yuman | 0.0 /100 | #325 | Tragic $45,446 |
| Immigrants | Haiti | 0.0 /100 | #326 | Tragic $45,266 |
| Immigrants | Bahamas | 0.0 /100 | #327 | Tragic $45,176 |
| Kiowa | 0.0 /100 | #328 | Tragic $45,094 |
| Yakama | 0.0 /100 | #329 | Tragic $45,002 |
| Immigrants | Mexico | 0.0 /100 | #330 | Tragic $44,960 |
| Natives/Alaskans | 0.0 /100 | #331 | Tragic $44,775 |
Demographics Similar to Immigrants from England by Median Male Earnings
In terms of median male earnings, the demographic groups most similar to Immigrants from England are Macedonian ($59,522, a difference of 0.010%), Italian ($59,551, a difference of 0.040%), Afghan ($59,554, a difference of 0.050%), Immigrants from Argentina ($59,491, a difference of 0.060%), and Immigrants from Moldova ($59,417, a difference of 0.18%).
| Demographics | Rating | Rank | Median Male Earnings |
| Immigrants | Ukraine | 99.5 /100 | #79 | Exceptional $59,820 |
| Immigrants | Hungary | 99.5 /100 | #80 | Exceptional $59,806 |
| Ukrainians | 99.4 /100 | #81 | Exceptional $59,728 |
| Croatians | 99.4 /100 | #82 | Exceptional $59,715 |
| Immigrants | Italy | 99.4 /100 | #83 | Exceptional $59,691 |
| Afghans | 99.3 /100 | #84 | Exceptional $59,554 |
| Italians | 99.3 /100 | #85 | Exceptional $59,551 |
| Immigrants | England | 99.3 /100 | #86 | Exceptional $59,527 |
| Macedonians | 99.3 /100 | #87 | Exceptional $59,522 |
| Immigrants | Argentina | 99.3 /100 | #88 | Exceptional $59,491 |
| Immigrants | Moldova | 99.2 /100 | #89 | Exceptional $59,417 |
| Austrians | 99.2 /100 | #90 | Exceptional $59,359 |
| Laotians | 99.2 /100 | #91 | Exceptional $59,351 |
| Immigrants | Kazakhstan | 99.1 /100 | #92 | Exceptional $59,278 |
| Immigrants | Southern Europe | 99.0 /100 | #93 | Exceptional $59,217 |