Black/African American vs Iranian Family Households with Children
COMPARE
Black/African American
Iranian
Family Households with Children
Family Households with Children Comparison
Blacks/African Americans
Iranians
26.5%
FAMILY HOUSEHOLDS WITH CHILDREN
0.1/ 100
METRIC RATING
293rd/ 347
METRIC RANK
27.7%
FAMILY HOUSEHOLDS WITH CHILDREN
85.2/ 100
METRIC RATING
133rd/ 347
METRIC RANK
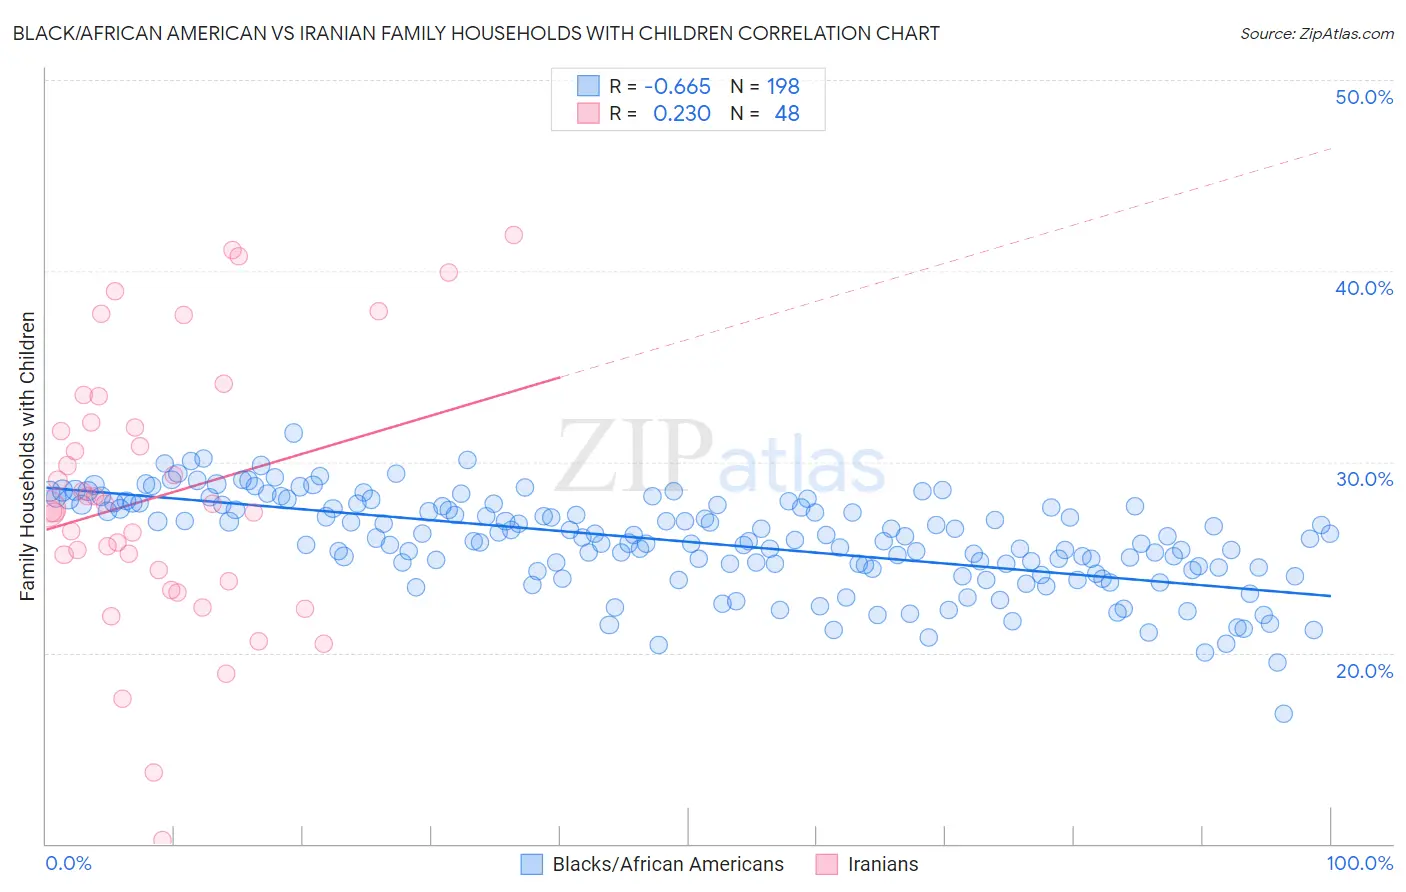
Black/African American vs Iranian Family Households with Children Correlation Chart
The statistical analysis conducted on geographies consisting of 564,937,994 people shows a significant negative correlation between the proportion of Blacks/African Americans and percentage of family households with children in the United States with a correlation coefficient (R) of -0.665 and weighted average of 26.5%. Similarly, the statistical analysis conducted on geographies consisting of 316,530,986 people shows a weak positive correlation between the proportion of Iranians and percentage of family households with children in the United States with a correlation coefficient (R) of 0.230 and weighted average of 27.7%, a difference of 4.7%.
Family Households with Children Correlation Summary
| Measurement | Black/African American | Iranian |
| Minimum | 16.8% | 10.2% |
| Maximum | 31.5% | 41.9% |
| Range | 14.7% | 31.7% |
| Mean | 25.8% | 28.2% |
| Median | 26.0% | 27.7% |
| Interquartile 25% (IQ1) | 24.5% | 24.0% |
| Interquartile 75% (IQ3) | 27.7% | 31.9% |
| Interquartile Range (IQR) | 3.2% | 7.9% |
| Standard Deviation (Sample) | 2.5% | 7.0% |
| Standard Deviation (Population) | 2.4% | 6.9% |
Similar Demographics by Family Households with Children
Demographics Similar to Blacks/African Americans by Family Households with Children
In terms of family households with children, the demographic groups most similar to Blacks/African Americans are Polish (26.5%, a difference of 0.050%), Albanian (26.5%, a difference of 0.060%), Bahamian (26.5%, a difference of 0.060%), Latvian (26.4%, a difference of 0.060%), and Macedonian (26.4%, a difference of 0.13%).
| Demographics | Rating | Rank | Family Households with Children |
| Immigrants | Senegal | 0.2 /100 | #286 | Tragic 26.5% |
| Shoshone | 0.2 /100 | #287 | Tragic 26.5% |
| Russians | 0.2 /100 | #288 | Tragic 26.5% |
| Immigrants | Sweden | 0.2 /100 | #289 | Tragic 26.5% |
| Albanians | 0.2 /100 | #290 | Tragic 26.5% |
| Bahamians | 0.2 /100 | #291 | Tragic 26.5% |
| Poles | 0.2 /100 | #292 | Tragic 26.5% |
| Blacks/African Americans | 0.1 /100 | #293 | Tragic 26.5% |
| Latvians | 0.1 /100 | #294 | Tragic 26.4% |
| Macedonians | 0.1 /100 | #295 | Tragic 26.4% |
| Croatians | 0.1 /100 | #296 | Tragic 26.4% |
| Armenians | 0.1 /100 | #297 | Tragic 26.4% |
| Immigrants | Western Europe | 0.1 /100 | #298 | Tragic 26.4% |
| Trinidadians and Tobagonians | 0.1 /100 | #299 | Tragic 26.4% |
| Paiute | 0.1 /100 | #300 | Tragic 26.4% |
Demographics Similar to Iranians by Family Households with Children
In terms of family households with children, the demographic groups most similar to Iranians are Immigrants from Panama (27.7%, a difference of 0.010%), Immigrants from Belize (27.7%, a difference of 0.020%), Immigrants from Ecuador (27.7%, a difference of 0.030%), Immigrants from Portugal (27.7%, a difference of 0.040%), and Immigrants from Dominican Republic (27.7%, a difference of 0.060%).
| Demographics | Rating | Rank | Family Households with Children |
| Immigrants | Ethiopia | 90.5 /100 | #126 | Exceptional 27.8% |
| Belizeans | 90.0 /100 | #127 | Exceptional 27.8% |
| Syrians | 89.7 /100 | #128 | Excellent 27.8% |
| Immigrants | Eritrea | 89.4 /100 | #129 | Excellent 27.8% |
| Cajuns | 87.6 /100 | #130 | Excellent 27.7% |
| Lebanese | 87.4 /100 | #131 | Excellent 27.7% |
| Immigrants | Belize | 85.7 /100 | #132 | Excellent 27.7% |
| Iranians | 85.2 /100 | #133 | Excellent 27.7% |
| Immigrants | Panama | 84.9 /100 | #134 | Excellent 27.7% |
| Immigrants | Ecuador | 84.6 /100 | #135 | Excellent 27.7% |
| Immigrants | Portugal | 84.1 /100 | #136 | Excellent 27.7% |
| Immigrants | Dominican Republic | 83.9 /100 | #137 | Excellent 27.7% |
| Uruguayans | 83.2 /100 | #138 | Excellent 27.7% |
| Vietnamese | 82.6 /100 | #139 | Excellent 27.7% |
| Spanish | 81.8 /100 | #140 | Excellent 27.7% |