Black/African American vs Immigrants from Bolivia Median Male Earnings
COMPARE
Black/African American
Immigrants from Bolivia
Median Male Earnings
Median Male Earnings Comparison
Blacks/African Americans
Immigrants from Bolivia
$45,523
MEDIAN MALE EARNINGS
0.0/ 100
METRIC RATING
324th/ 347
METRIC RANK
$60,088
MEDIAN MALE EARNINGS
99.6/ 100
METRIC RATING
75th/ 347
METRIC RANK
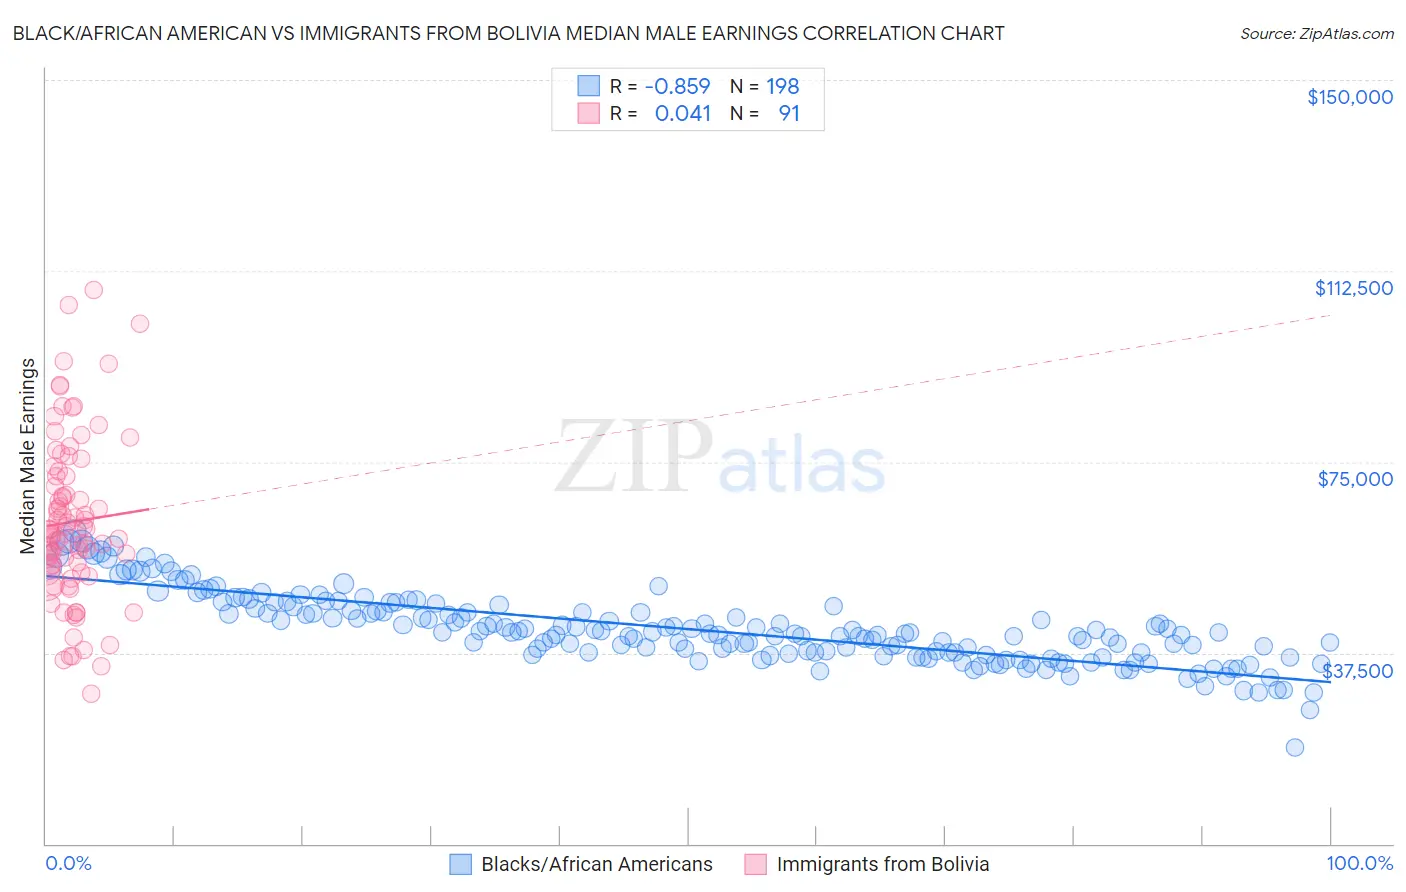
Black/African American vs Immigrants from Bolivia Median Male Earnings Correlation Chart
The statistical analysis conducted on geographies consisting of 563,678,879 people shows a very strong negative correlation between the proportion of Blacks/African Americans and median male earnings in the United States with a correlation coefficient (R) of -0.859 and weighted average of $45,523. Similarly, the statistical analysis conducted on geographies consisting of 158,704,796 people shows no correlation between the proportion of Immigrants from Bolivia and median male earnings in the United States with a correlation coefficient (R) of 0.041 and weighted average of $60,088, a difference of 32.0%.
Median Male Earnings Correlation Summary
| Measurement | Black/African American | Immigrants from Bolivia |
| Minimum | $18,859 | $29,412 |
| Maximum | $61,488 | $108,819 |
| Range | $42,630 | $79,407 |
| Mean | $42,190 | $63,204 |
| Median | $41,285 | $61,601 |
| Interquartile 25% (IQ1) | $37,450 | $53,242 |
| Interquartile 75% (IQ3) | $46,253 | $72,136 |
| Interquartile Range (IQR) | $8,804 | $18,895 |
| Standard Deviation (Sample) | $6,999 | $16,071 |
| Standard Deviation (Population) | $6,981 | $15,982 |
Similar Demographics by Median Male Earnings
Demographics Similar to Blacks/African Americans by Median Male Earnings
In terms of median male earnings, the demographic groups most similar to Blacks/African Americans are Immigrants from Central America ($45,538, a difference of 0.030%), Sioux ($45,566, a difference of 0.090%), Yuman ($45,446, a difference of 0.17%), Fijian ($45,607, a difference of 0.18%), and Immigrants from Haiti ($45,266, a difference of 0.57%).
| Demographics | Rating | Rank | Median Male Earnings |
| Mexicans | 0.0 /100 | #317 | Tragic $46,147 |
| Cheyenne | 0.0 /100 | #318 | Tragic $46,062 |
| Haitians | 0.0 /100 | #319 | Tragic $45,903 |
| Immigrants | Honduras | 0.0 /100 | #320 | Tragic $45,787 |
| Fijians | 0.0 /100 | #321 | Tragic $45,607 |
| Sioux | 0.0 /100 | #322 | Tragic $45,566 |
| Immigrants | Central America | 0.0 /100 | #323 | Tragic $45,538 |
| Blacks/African Americans | 0.0 /100 | #324 | Tragic $45,523 |
| Yuman | 0.0 /100 | #325 | Tragic $45,446 |
| Immigrants | Haiti | 0.0 /100 | #326 | Tragic $45,266 |
| Immigrants | Bahamas | 0.0 /100 | #327 | Tragic $45,176 |
| Kiowa | 0.0 /100 | #328 | Tragic $45,094 |
| Yakama | 0.0 /100 | #329 | Tragic $45,002 |
| Immigrants | Mexico | 0.0 /100 | #330 | Tragic $44,960 |
| Natives/Alaskans | 0.0 /100 | #331 | Tragic $44,775 |
Demographics Similar to Immigrants from Bolivia by Median Male Earnings
In terms of median male earnings, the demographic groups most similar to Immigrants from Bolivia are Romanian ($60,063, a difference of 0.040%), Argentinean ($60,117, a difference of 0.050%), Paraguayan ($59,975, a difference of 0.19%), Immigrants from Egypt ($59,925, a difference of 0.27%), and Immigrants from North America ($60,265, a difference of 0.29%).
| Demographics | Rating | Rank | Median Male Earnings |
| Immigrants | Serbia | 99.7 /100 | #68 | Exceptional $60,600 |
| Immigrants | Canada | 99.7 /100 | #69 | Exceptional $60,388 |
| Immigrants | Bulgaria | 99.7 /100 | #70 | Exceptional $60,358 |
| Mongolians | 99.7 /100 | #71 | Exceptional $60,350 |
| Immigrants | Western Europe | 99.7 /100 | #72 | Exceptional $60,334 |
| Immigrants | North America | 99.7 /100 | #73 | Exceptional $60,265 |
| Argentineans | 99.6 /100 | #74 | Exceptional $60,117 |
| Immigrants | Bolivia | 99.6 /100 | #75 | Exceptional $60,088 |
| Romanians | 99.6 /100 | #76 | Exceptional $60,063 |
| Paraguayans | 99.5 /100 | #77 | Exceptional $59,975 |
| Immigrants | Egypt | 99.5 /100 | #78 | Exceptional $59,925 |
| Immigrants | Ukraine | 99.5 /100 | #79 | Exceptional $59,820 |
| Immigrants | Hungary | 99.5 /100 | #80 | Exceptional $59,806 |
| Ukrainians | 99.4 /100 | #81 | Exceptional $59,728 |
| Croatians | 99.4 /100 | #82 | Exceptional $59,715 |