Greek vs Iranian Median Male Earnings
COMPARE
Greek
Iranian
Median Male Earnings
Median Male Earnings Comparison
Greeks
Iranians
$61,242
MEDIAN MALE EARNINGS
99.9/ 100
METRIC RATING
55th/ 347
METRIC RANK
$70,648
MEDIAN MALE EARNINGS
100.0/ 100
METRIC RATING
6th/ 347
METRIC RANK
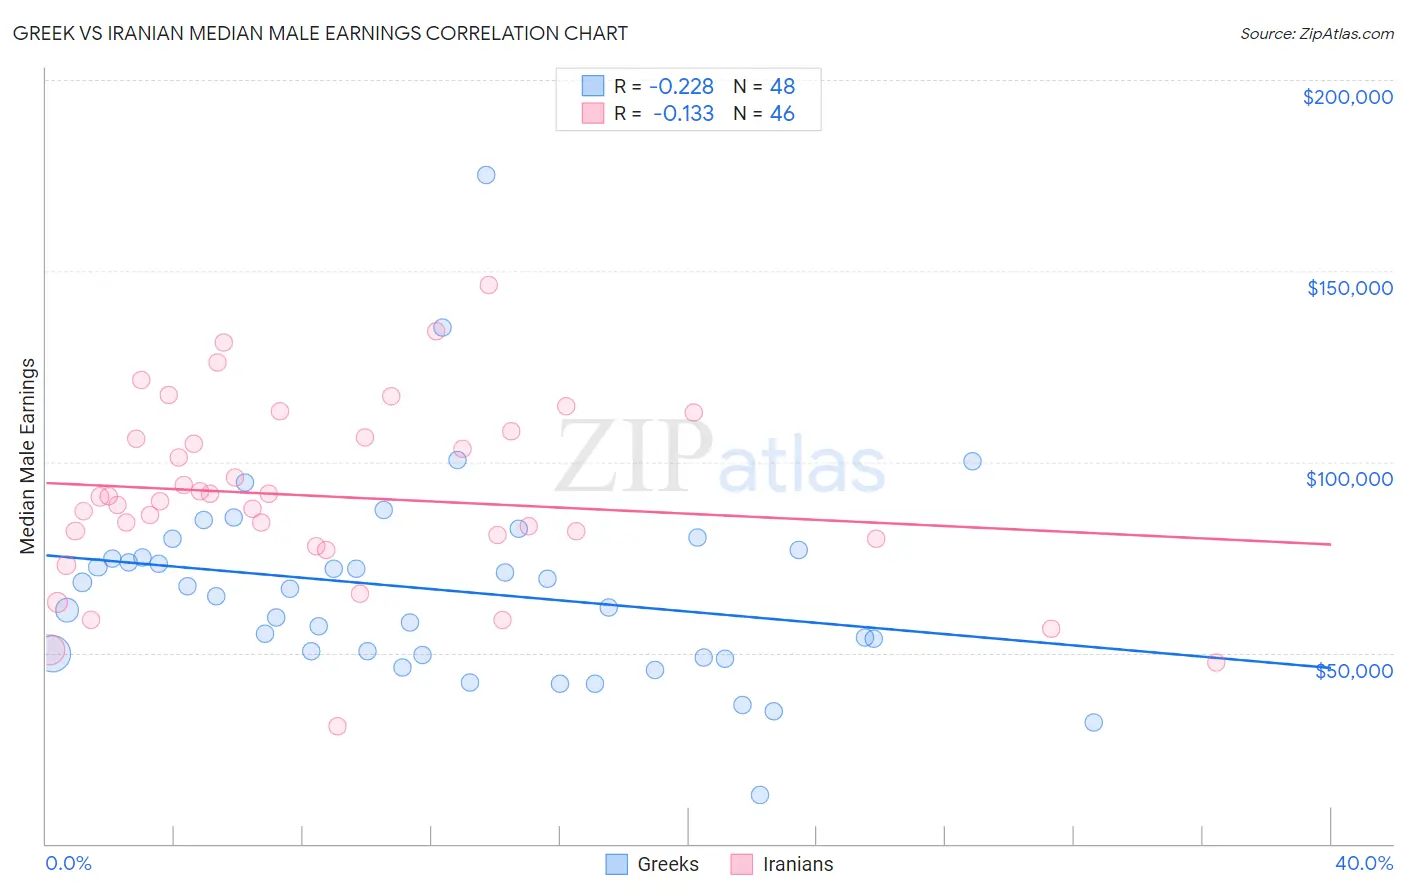
Greek vs Iranian Median Male Earnings Correlation Chart
The statistical analysis conducted on geographies consisting of 482,499,684 people shows a weak negative correlation between the proportion of Greeks and median male earnings in the United States with a correlation coefficient (R) of -0.228 and weighted average of $61,242. Similarly, the statistical analysis conducted on geographies consisting of 316,851,455 people shows a poor negative correlation between the proportion of Iranians and median male earnings in the United States with a correlation coefficient (R) of -0.133 and weighted average of $70,648, a difference of 15.4%.
Median Male Earnings Correlation Summary
| Measurement | Greek | Iranian |
| Minimum | $12,679 | $30,816 |
| Maximum | $175,000 | $146,250 |
| Range | $162,321 | $115,434 |
| Mean | $66,512 | $91,002 |
| Median | $65,740 | $90,293 |
| Interquartile 25% (IQ1) | $49,612 | $79,904 |
| Interquartile 75% (IQ3) | $75,987 | $106,492 |
| Interquartile Range (IQR) | $26,375 | $26,588 |
| Standard Deviation (Sample) | $26,480 | $24,044 |
| Standard Deviation (Population) | $26,203 | $23,781 |
Similar Demographics by Median Male Earnings
Demographics Similar to Greeks by Median Male Earnings
In terms of median male earnings, the demographic groups most similar to Greeks are Lithuanian ($61,228, a difference of 0.020%), Immigrants from Scotland ($61,220, a difference of 0.040%), New Zealander ($61,199, a difference of 0.070%), Immigrants from Netherlands ($61,096, a difference of 0.24%), and Egyptian ($61,095, a difference of 0.24%).
| Demographics | Rating | Rank | Median Male Earnings |
| Immigrants | Malaysia | 99.9 /100 | #48 | Exceptional $62,121 |
| Immigrants | Europe | 99.9 /100 | #49 | Exceptional $62,057 |
| Bhutanese | 99.9 /100 | #50 | Exceptional $61,759 |
| Estonians | 99.9 /100 | #51 | Exceptional $61,710 |
| Immigrants | Norway | 99.9 /100 | #52 | Exceptional $61,628 |
| South Africans | 99.9 /100 | #53 | Exceptional $61,460 |
| Immigrants | Latvia | 99.9 /100 | #54 | Exceptional $61,422 |
| Greeks | 99.9 /100 | #55 | Exceptional $61,242 |
| Lithuanians | 99.9 /100 | #56 | Exceptional $61,228 |
| Immigrants | Scotland | 99.9 /100 | #57 | Exceptional $61,220 |
| New Zealanders | 99.9 /100 | #58 | Exceptional $61,199 |
| Immigrants | Netherlands | 99.8 /100 | #59 | Exceptional $61,096 |
| Egyptians | 99.8 /100 | #60 | Exceptional $61,095 |
| Bolivians | 99.8 /100 | #61 | Exceptional $61,066 |
| Immigrants | Romania | 99.8 /100 | #62 | Exceptional $61,040 |
Demographics Similar to Iranians by Median Male Earnings
In terms of median male earnings, the demographic groups most similar to Iranians are Immigrants from Hong Kong ($70,146, a difference of 0.72%), Immigrants from Singapore ($71,348, a difference of 0.99%), Immigrants from Iran ($69,284, a difference of 2.0%), Thai ($72,135, a difference of 2.1%), and Immigrants from South Central Asia ($68,960, a difference of 2.5%).
| Demographics | Rating | Rank | Median Male Earnings |
| Filipinos | 100.0 /100 | #1 | Exceptional $74,224 |
| Immigrants | India | 100.0 /100 | #2 | Exceptional $74,207 |
| Immigrants | Taiwan | 100.0 /100 | #3 | Exceptional $74,031 |
| Thais | 100.0 /100 | #4 | Exceptional $72,135 |
| Immigrants | Singapore | 100.0 /100 | #5 | Exceptional $71,348 |
| Iranians | 100.0 /100 | #6 | Exceptional $70,648 |
| Immigrants | Hong Kong | 100.0 /100 | #7 | Exceptional $70,146 |
| Immigrants | Iran | 100.0 /100 | #8 | Exceptional $69,284 |
| Immigrants | South Central Asia | 100.0 /100 | #9 | Exceptional $68,960 |
| Immigrants | Israel | 100.0 /100 | #10 | Exceptional $68,716 |
| Immigrants | Ireland | 100.0 /100 | #11 | Exceptional $67,698 |
| Immigrants | Australia | 100.0 /100 | #12 | Exceptional $67,634 |
| Immigrants | China | 100.0 /100 | #13 | Exceptional $67,353 |
| Okinawans | 100.0 /100 | #14 | Exceptional $67,232 |
| Immigrants | Eastern Asia | 100.0 /100 | #15 | Exceptional $66,903 |