Black/African American vs Immigrants from Belize Median Male Earnings
COMPARE
Black/African American
Immigrants from Belize
Median Male Earnings
Median Male Earnings Comparison
Blacks/African Americans
Immigrants from Belize
$45,523
MEDIAN MALE EARNINGS
0.0/ 100
METRIC RATING
324th/ 347
METRIC RANK
$47,809
MEDIAN MALE EARNINGS
0.1/ 100
METRIC RATING
290th/ 347
METRIC RANK
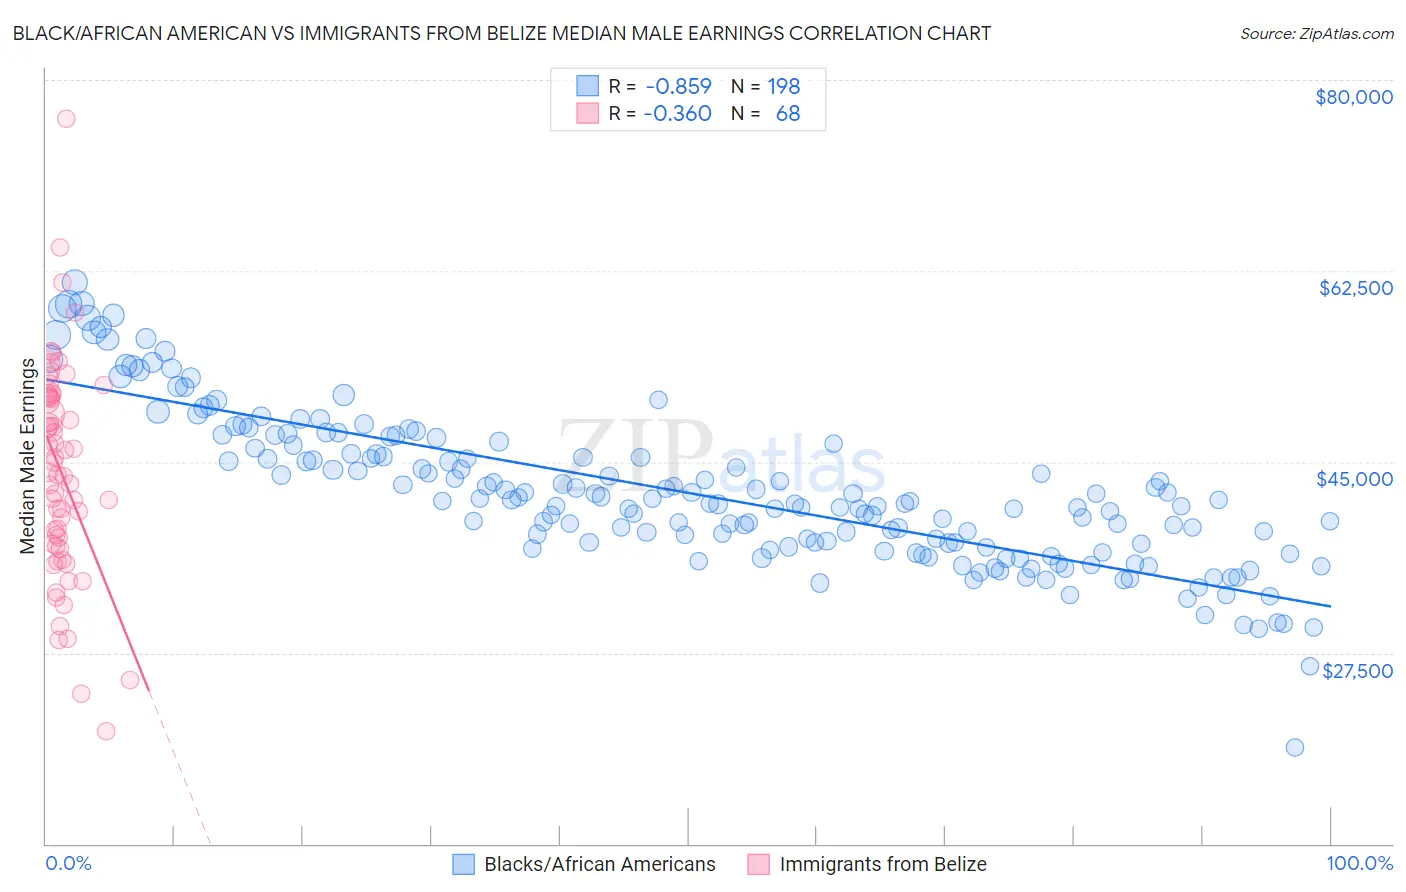
Black/African American vs Immigrants from Belize Median Male Earnings Correlation Chart
The statistical analysis conducted on geographies consisting of 563,678,879 people shows a very strong negative correlation between the proportion of Blacks/African Americans and median male earnings in the United States with a correlation coefficient (R) of -0.859 and weighted average of $45,523. Similarly, the statistical analysis conducted on geographies consisting of 130,305,697 people shows a mild negative correlation between the proportion of Immigrants from Belize and median male earnings in the United States with a correlation coefficient (R) of -0.360 and weighted average of $47,809, a difference of 5.0%.
Median Male Earnings Correlation Summary
| Measurement | Black/African American | Immigrants from Belize |
| Minimum | $18,859 | $20,292 |
| Maximum | $61,488 | $76,469 |
| Range | $42,630 | $56,177 |
| Mean | $42,190 | $44,004 |
| Median | $41,285 | $43,946 |
| Interquartile 25% (IQ1) | $37,450 | $37,392 |
| Interquartile 75% (IQ3) | $46,253 | $51,048 |
| Interquartile Range (IQR) | $8,804 | $13,656 |
| Standard Deviation (Sample) | $6,999 | $9,886 |
| Standard Deviation (Population) | $6,981 | $9,813 |
Similar Demographics by Median Male Earnings
Demographics Similar to Blacks/African Americans by Median Male Earnings
In terms of median male earnings, the demographic groups most similar to Blacks/African Americans are Immigrants from Central America ($45,538, a difference of 0.030%), Sioux ($45,566, a difference of 0.090%), Yuman ($45,446, a difference of 0.17%), Fijian ($45,607, a difference of 0.18%), and Immigrants from Haiti ($45,266, a difference of 0.57%).
| Demographics | Rating | Rank | Median Male Earnings |
| Mexicans | 0.0 /100 | #317 | Tragic $46,147 |
| Cheyenne | 0.0 /100 | #318 | Tragic $46,062 |
| Haitians | 0.0 /100 | #319 | Tragic $45,903 |
| Immigrants | Honduras | 0.0 /100 | #320 | Tragic $45,787 |
| Fijians | 0.0 /100 | #321 | Tragic $45,607 |
| Sioux | 0.0 /100 | #322 | Tragic $45,566 |
| Immigrants | Central America | 0.0 /100 | #323 | Tragic $45,538 |
| Blacks/African Americans | 0.0 /100 | #324 | Tragic $45,523 |
| Yuman | 0.0 /100 | #325 | Tragic $45,446 |
| Immigrants | Haiti | 0.0 /100 | #326 | Tragic $45,266 |
| Immigrants | Bahamas | 0.0 /100 | #327 | Tragic $45,176 |
| Kiowa | 0.0 /100 | #328 | Tragic $45,094 |
| Yakama | 0.0 /100 | #329 | Tragic $45,002 |
| Immigrants | Mexico | 0.0 /100 | #330 | Tragic $44,960 |
| Natives/Alaskans | 0.0 /100 | #331 | Tragic $44,775 |
Demographics Similar to Immigrants from Belize by Median Male Earnings
In terms of median male earnings, the demographic groups most similar to Immigrants from Belize are Chickasaw ($47,832, a difference of 0.050%), Choctaw ($47,729, a difference of 0.17%), Shoshone ($47,930, a difference of 0.25%), Immigrants from Dominica ($47,651, a difference of 0.33%), and Immigrants from El Salvador ($47,973, a difference of 0.34%).
| Demographics | Rating | Rank | Median Male Earnings |
| Immigrants | Jamaica | 0.2 /100 | #283 | Tragic $48,040 |
| Africans | 0.2 /100 | #284 | Tragic $47,994 |
| Paiute | 0.2 /100 | #285 | Tragic $47,991 |
| Mexican American Indians | 0.2 /100 | #286 | Tragic $47,990 |
| Immigrants | El Salvador | 0.2 /100 | #287 | Tragic $47,973 |
| Shoshone | 0.2 /100 | #288 | Tragic $47,930 |
| Chickasaw | 0.1 /100 | #289 | Tragic $47,832 |
| Immigrants | Belize | 0.1 /100 | #290 | Tragic $47,809 |
| Choctaw | 0.1 /100 | #291 | Tragic $47,729 |
| Immigrants | Dominica | 0.1 /100 | #292 | Tragic $47,651 |
| Indonesians | 0.1 /100 | #293 | Tragic $47,503 |
| Immigrants | Nicaragua | 0.1 /100 | #294 | Tragic $47,482 |
| Central American Indians | 0.1 /100 | #295 | Tragic $47,433 |
| Inupiat | 0.1 /100 | #296 | Tragic $47,281 |
| Dominicans | 0.1 /100 | #297 | Tragic $47,204 |