Black/African American vs Iranian Cognitive Disability
COMPARE
Black/African American
Iranian
Cognitive Disability
Cognitive Disability Comparison
Blacks/African Americans
Iranians
19.0%
COGNITIVE DISABILITY
0.0/ 100
METRIC RATING
336th/ 347
METRIC RANK
16.5%
COGNITIVE DISABILITY
99.8/ 100
METRIC RATING
49th/ 347
METRIC RANK
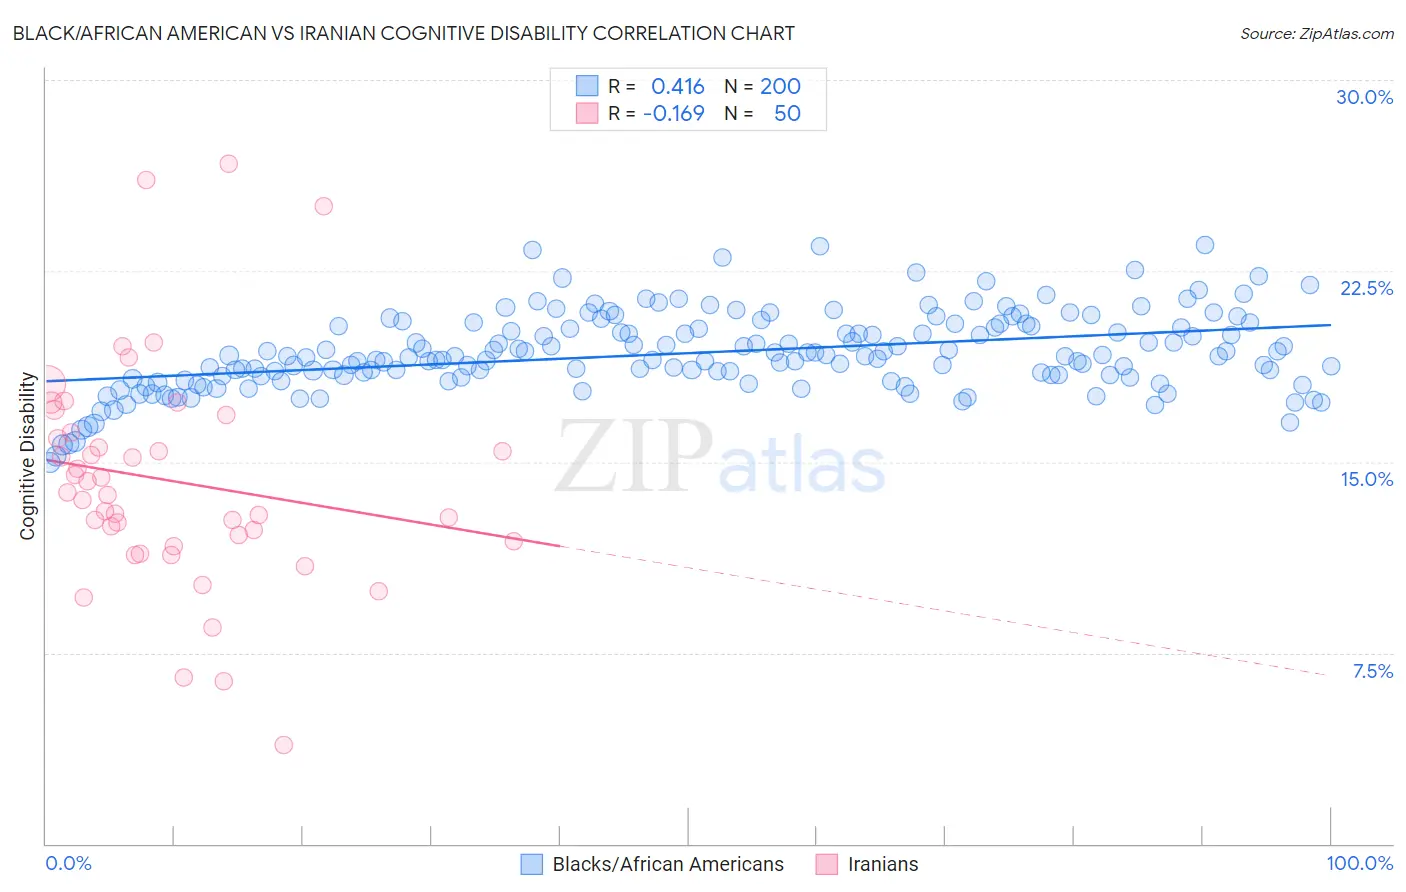
Black/African American vs Iranian Cognitive Disability Correlation Chart
The statistical analysis conducted on geographies consisting of 565,879,881 people shows a moderate positive correlation between the proportion of Blacks/African Americans and percentage of population with cognitive disability in the United States with a correlation coefficient (R) of 0.416 and weighted average of 19.0%. Similarly, the statistical analysis conducted on geographies consisting of 316,831,164 people shows a poor negative correlation between the proportion of Iranians and percentage of population with cognitive disability in the United States with a correlation coefficient (R) of -0.169 and weighted average of 16.5%, a difference of 15.3%.
Cognitive Disability Correlation Summary
| Measurement | Black/African American | Iranian |
| Minimum | 15.0% | 3.9% |
| Maximum | 23.5% | 26.7% |
| Range | 8.6% | 22.8% |
| Mean | 19.3% | 14.3% |
| Median | 19.1% | 13.7% |
| Interquartile 25% (IQ1) | 18.3% | 11.9% |
| Interquartile 75% (IQ3) | 20.3% | 16.2% |
| Interquartile Range (IQR) | 2.0% | 4.3% |
| Standard Deviation (Sample) | 1.5% | 4.4% |
| Standard Deviation (Population) | 1.5% | 4.4% |
Similar Demographics by Cognitive Disability
Demographics Similar to Blacks/African Americans by Cognitive Disability
In terms of cognitive disability, the demographic groups most similar to Blacks/African Americans are Immigrants from Saudi Arabia (19.1%, a difference of 0.13%), Senegalese (19.0%, a difference of 0.29%), Lumbee (19.1%, a difference of 0.47%), Sudanese (18.9%, a difference of 0.84%), and Puerto Rican (19.2%, a difference of 0.95%).
| Demographics | Rating | Rank | Cognitive Disability |
| Navajo | 0.0 /100 | #329 | Tragic 18.8% |
| Immigrants | Dominican Republic | 0.0 /100 | #330 | Tragic 18.8% |
| Pima | 0.0 /100 | #331 | Tragic 18.8% |
| Immigrants | Sudan | 0.0 /100 | #332 | Tragic 18.8% |
| Immigrants | Yemen | 0.0 /100 | #333 | Tragic 18.8% |
| Sudanese | 0.0 /100 | #334 | Tragic 18.9% |
| Senegalese | 0.0 /100 | #335 | Tragic 19.0% |
| Blacks/African Americans | 0.0 /100 | #336 | Tragic 19.0% |
| Immigrants | Saudi Arabia | 0.0 /100 | #337 | Tragic 19.1% |
| Lumbee | 0.0 /100 | #338 | Tragic 19.1% |
| Puerto Ricans | 0.0 /100 | #339 | Tragic 19.2% |
| Cape Verdeans | 0.0 /100 | #340 | Tragic 19.2% |
| Tohono O'odham | 0.0 /100 | #341 | Tragic 19.3% |
| Houma | 0.0 /100 | #342 | Tragic 19.3% |
| Immigrants | Zaire | 0.0 /100 | #343 | Tragic 19.4% |
Demographics Similar to Iranians by Cognitive Disability
In terms of cognitive disability, the demographic groups most similar to Iranians are Norwegian (16.5%, a difference of 0.010%), Immigrants from Italy (16.5%, a difference of 0.040%), Immigrants from North America (16.5%, a difference of 0.040%), Immigrants from Korea (16.5%, a difference of 0.050%), and Immigrants from Colombia (16.5%, a difference of 0.070%).
| Demographics | Rating | Rank | Cognitive Disability |
| Hungarians | 99.9 /100 | #42 | Exceptional 16.5% |
| Immigrants | Canada | 99.8 /100 | #43 | Exceptional 16.5% |
| Macedonians | 99.8 /100 | #44 | Exceptional 16.5% |
| Immigrants | Europe | 99.8 /100 | #45 | Exceptional 16.5% |
| Immigrants | Colombia | 99.8 /100 | #46 | Exceptional 16.5% |
| Immigrants | Italy | 99.8 /100 | #47 | Exceptional 16.5% |
| Immigrants | North America | 99.8 /100 | #48 | Exceptional 16.5% |
| Iranians | 99.8 /100 | #49 | Exceptional 16.5% |
| Norwegians | 99.8 /100 | #50 | Exceptional 16.5% |
| Immigrants | Korea | 99.8 /100 | #51 | Exceptional 16.5% |
| Soviet Union | 99.8 /100 | #52 | Exceptional 16.5% |
| Swedes | 99.8 /100 | #53 | Exceptional 16.5% |
| Immigrants | Iran | 99.8 /100 | #54 | Exceptional 16.5% |
| Immigrants | Venezuela | 99.7 /100 | #55 | Exceptional 16.5% |
| Austrians | 99.7 /100 | #56 | Exceptional 16.6% |