Black/African American vs Russian Median Male Earnings
COMPARE
Black/African American
Russian
Median Male Earnings
Median Male Earnings Comparison
Blacks/African Americans
Russians
$45,523
MEDIAN MALE EARNINGS
0.0/ 100
METRIC RATING
324th/ 347
METRIC RANK
$63,939
MEDIAN MALE EARNINGS
100.0/ 100
METRIC RATING
28th/ 347
METRIC RANK
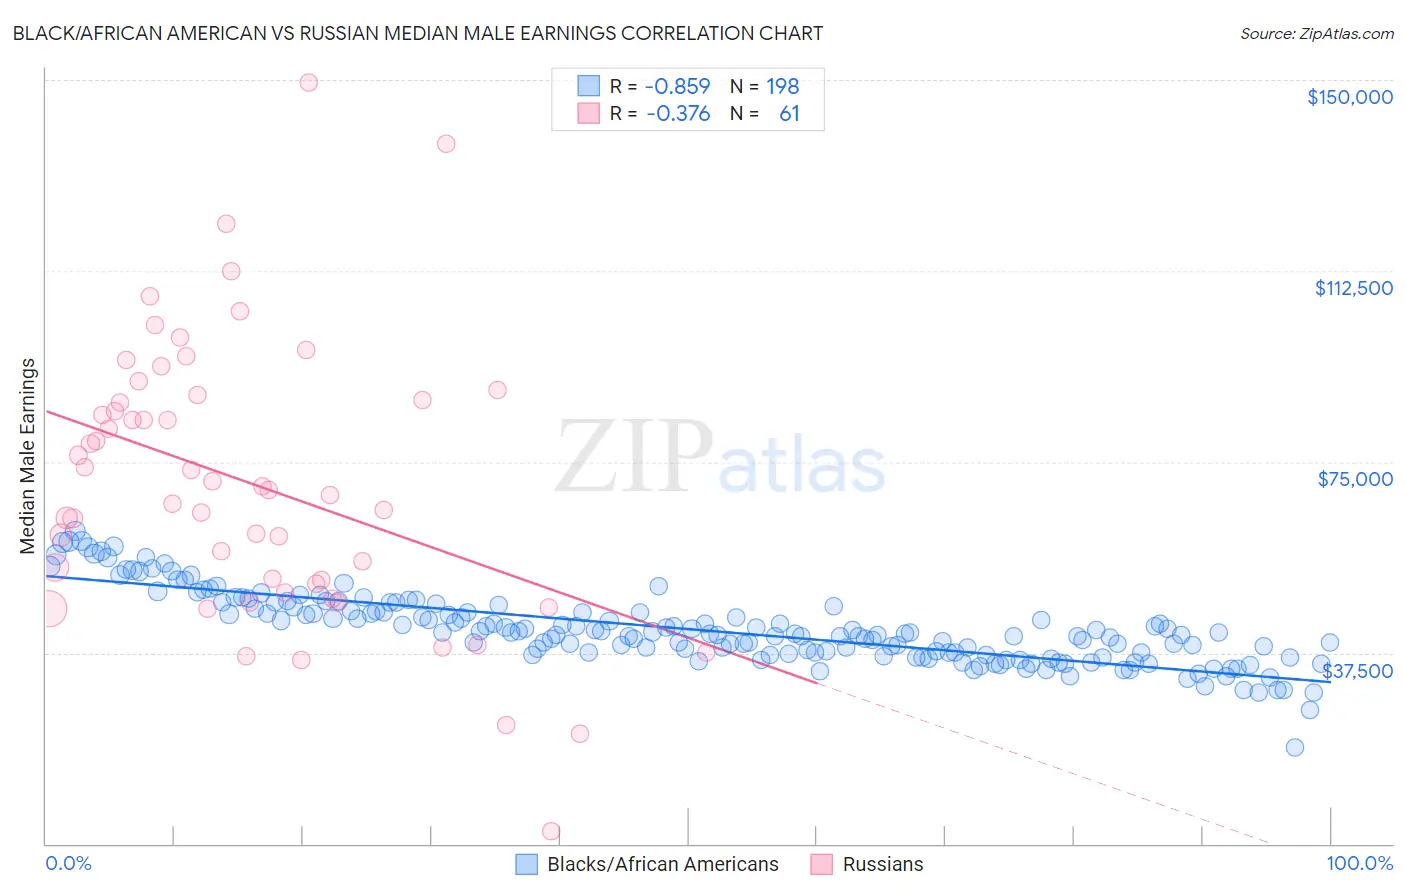
Black/African American vs Russian Median Male Earnings Correlation Chart
The statistical analysis conducted on geographies consisting of 563,678,879 people shows a very strong negative correlation between the proportion of Blacks/African Americans and median male earnings in the United States with a correlation coefficient (R) of -0.859 and weighted average of $45,523. Similarly, the statistical analysis conducted on geographies consisting of 511,765,575 people shows a mild negative correlation between the proportion of Russians and median male earnings in the United States with a correlation coefficient (R) of -0.376 and weighted average of $63,939, a difference of 40.5%.
Median Male Earnings Correlation Summary
| Measurement | Black/African American | Russian |
| Minimum | $18,859 | $2,499 |
| Maximum | $61,488 | $149,573 |
| Range | $42,630 | $147,074 |
| Mean | $42,190 | $70,744 |
| Median | $41,285 | $69,557 |
| Interquartile 25% (IQ1) | $37,450 | $50,291 |
| Interquartile 75% (IQ3) | $46,253 | $87,600 |
| Interquartile Range (IQR) | $8,804 | $37,309 |
| Standard Deviation (Sample) | $6,999 | $27,498 |
| Standard Deviation (Population) | $6,981 | $27,272 |
Similar Demographics by Median Male Earnings
Demographics Similar to Blacks/African Americans by Median Male Earnings
In terms of median male earnings, the demographic groups most similar to Blacks/African Americans are Immigrants from Central America ($45,538, a difference of 0.030%), Sioux ($45,566, a difference of 0.090%), Yuman ($45,446, a difference of 0.17%), Fijian ($45,607, a difference of 0.18%), and Immigrants from Haiti ($45,266, a difference of 0.57%).
| Demographics | Rating | Rank | Median Male Earnings |
| Mexicans | 0.0 /100 | #317 | Tragic $46,147 |
| Cheyenne | 0.0 /100 | #318 | Tragic $46,062 |
| Haitians | 0.0 /100 | #319 | Tragic $45,903 |
| Immigrants | Honduras | 0.0 /100 | #320 | Tragic $45,787 |
| Fijians | 0.0 /100 | #321 | Tragic $45,607 |
| Sioux | 0.0 /100 | #322 | Tragic $45,566 |
| Immigrants | Central America | 0.0 /100 | #323 | Tragic $45,538 |
| Blacks/African Americans | 0.0 /100 | #324 | Tragic $45,523 |
| Yuman | 0.0 /100 | #325 | Tragic $45,446 |
| Immigrants | Haiti | 0.0 /100 | #326 | Tragic $45,266 |
| Immigrants | Bahamas | 0.0 /100 | #327 | Tragic $45,176 |
| Kiowa | 0.0 /100 | #328 | Tragic $45,094 |
| Yakama | 0.0 /100 | #329 | Tragic $45,002 |
| Immigrants | Mexico | 0.0 /100 | #330 | Tragic $44,960 |
| Natives/Alaskans | 0.0 /100 | #331 | Tragic $44,775 |
Demographics Similar to Russians by Median Male Earnings
In terms of median male earnings, the demographic groups most similar to Russians are Immigrants from Switzerland ($63,944, a difference of 0.010%), Asian ($63,827, a difference of 0.17%), Immigrants from France ($63,715, a difference of 0.35%), Turkish ($64,253, a difference of 0.49%), and Latvian ($63,498, a difference of 0.69%).
| Demographics | Rating | Rank | Median Male Earnings |
| Immigrants | Sweden | 100.0 /100 | #21 | Exceptional $65,406 |
| Burmese | 100.0 /100 | #22 | Exceptional $65,236 |
| Immigrants | Korea | 100.0 /100 | #23 | Exceptional $65,079 |
| Immigrants | Northern Europe | 100.0 /100 | #24 | Exceptional $64,987 |
| Immigrants | Denmark | 100.0 /100 | #25 | Exceptional $64,625 |
| Turks | 100.0 /100 | #26 | Exceptional $64,253 |
| Immigrants | Switzerland | 100.0 /100 | #27 | Exceptional $63,944 |
| Russians | 100.0 /100 | #28 | Exceptional $63,939 |
| Asians | 100.0 /100 | #29 | Exceptional $63,827 |
| Immigrants | France | 100.0 /100 | #30 | Exceptional $63,715 |
| Latvians | 100.0 /100 | #31 | Exceptional $63,498 |
| Soviet Union | 100.0 /100 | #32 | Exceptional $63,382 |
| Immigrants | Lithuania | 100.0 /100 | #33 | Exceptional $63,346 |
| Immigrants | Russia | 100.0 /100 | #34 | Exceptional $63,326 |
| Immigrants | Asia | 100.0 /100 | #35 | Exceptional $63,240 |