Bhutanese vs Kenyan Median Family Income
COMPARE
Bhutanese
Kenyan
Median Family Income
Median Family Income Comparison
Bhutanese
Kenyans
$119,800
MEDIAN FAMILY INCOME
100.0/ 100
METRIC RATING
33rd/ 347
METRIC RANK
$101,417
MEDIAN FAMILY INCOME
34.5/ 100
METRIC RATING
183rd/ 347
METRIC RANK
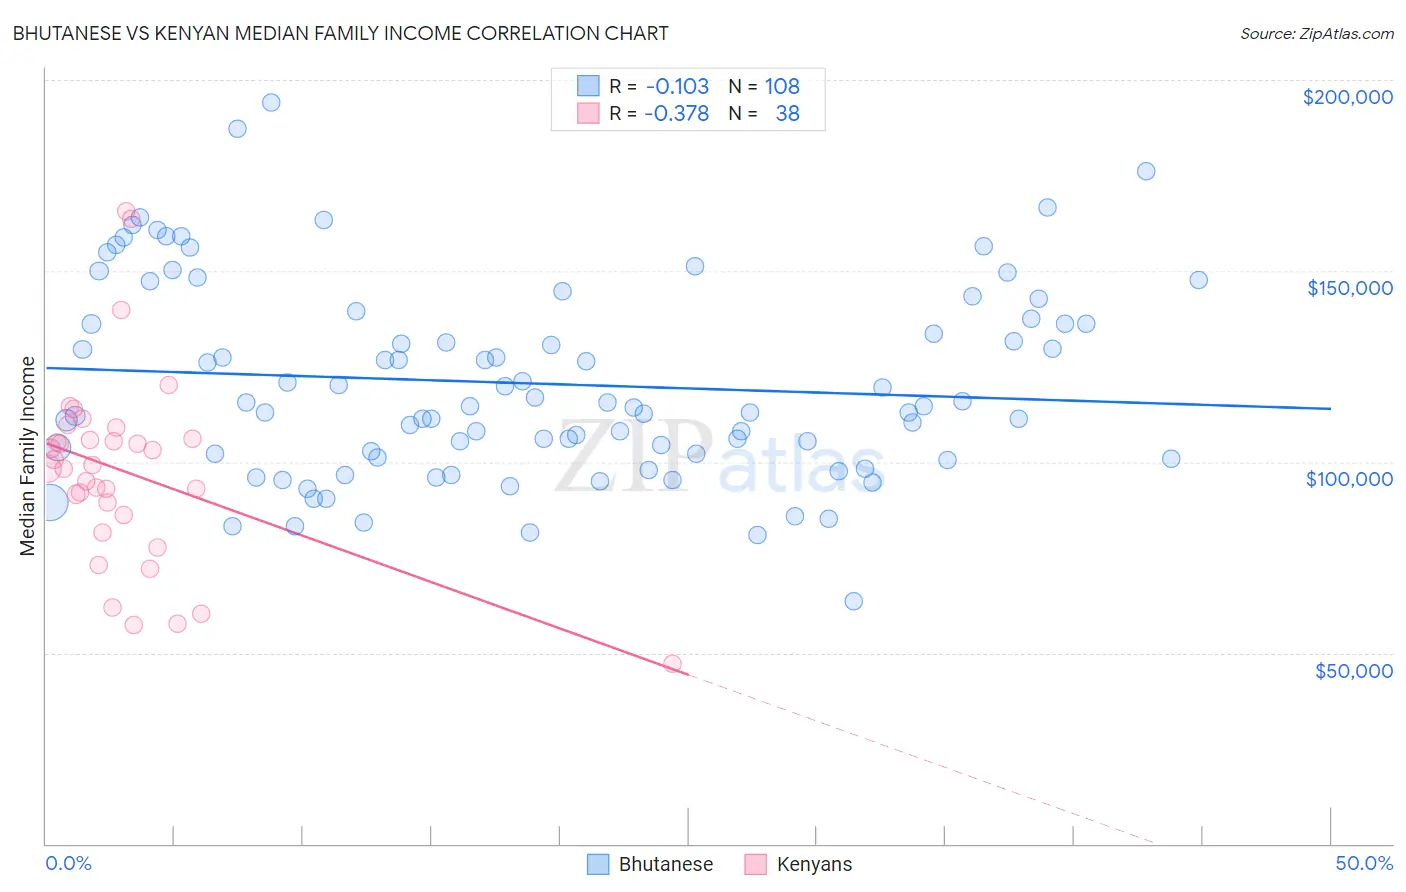
Bhutanese vs Kenyan Median Family Income Correlation Chart
The statistical analysis conducted on geographies consisting of 454,953,353 people shows a poor negative correlation between the proportion of Bhutanese and median family income in the United States with a correlation coefficient (R) of -0.103 and weighted average of $119,800. Similarly, the statistical analysis conducted on geographies consisting of 168,122,613 people shows a mild negative correlation between the proportion of Kenyans and median family income in the United States with a correlation coefficient (R) of -0.378 and weighted average of $101,417, a difference of 18.1%.
Median Family Income Correlation Summary
| Measurement | Bhutanese | Kenyan |
| Minimum | $63,382 | $47,000 |
| Maximum | $194,165 | $165,640 |
| Range | $130,783 | $118,640 |
| Mean | $120,532 | $97,471 |
| Median | $114,614 | $98,633 |
| Interquartile 25% (IQ1) | $101,662 | $86,023 |
| Interquartile 75% (IQ3) | $136,845 | $106,111 |
| Interquartile Range (IQR) | $35,183 | $20,088 |
| Standard Deviation (Sample) | $25,704 | $25,158 |
| Standard Deviation (Population) | $25,585 | $24,824 |
Similar Demographics by Median Family Income
Demographics Similar to Bhutanese by Median Family Income
In terms of median family income, the demographic groups most similar to Bhutanese are Asian ($119,955, a difference of 0.13%), Immigrants from France ($120,076, a difference of 0.23%), Bolivian ($119,479, a difference of 0.27%), Immigrants from Sri Lanka ($120,263, a difference of 0.39%), and Latvian ($120,301, a difference of 0.42%).
| Demographics | Rating | Rank | Median Family Income |
| Immigrants | Switzerland | 100.0 /100 | #26 | Exceptional $120,726 |
| Russians | 100.0 /100 | #27 | Exceptional $120,487 |
| Immigrants | Denmark | 100.0 /100 | #28 | Exceptional $120,445 |
| Latvians | 100.0 /100 | #29 | Exceptional $120,301 |
| Immigrants | Sri Lanka | 100.0 /100 | #30 | Exceptional $120,263 |
| Immigrants | France | 100.0 /100 | #31 | Exceptional $120,076 |
| Asians | 100.0 /100 | #32 | Exceptional $119,955 |
| Bhutanese | 100.0 /100 | #33 | Exceptional $119,800 |
| Bolivians | 100.0 /100 | #34 | Exceptional $119,479 |
| Soviet Union | 100.0 /100 | #35 | Exceptional $119,262 |
| Israelis | 100.0 /100 | #36 | Exceptional $118,577 |
| Australians | 100.0 /100 | #37 | Exceptional $118,440 |
| Immigrants | Turkey | 100.0 /100 | #38 | Exceptional $118,325 |
| Immigrants | Asia | 100.0 /100 | #39 | Exceptional $118,291 |
| Immigrants | Lithuania | 100.0 /100 | #40 | Exceptional $118,053 |
Demographics Similar to Kenyans by Median Family Income
In terms of median family income, the demographic groups most similar to Kenyans are Immigrants from Costa Rica ($101,354, a difference of 0.060%), Tsimshian ($101,543, a difference of 0.12%), Spaniard ($101,617, a difference of 0.20%), French Canadian ($101,634, a difference of 0.21%), and Dutch ($101,192, a difference of 0.22%).
| Demographics | Rating | Rank | Median Family Income |
| French | 46.1 /100 | #176 | Average $102,368 |
| Germans | 44.6 /100 | #177 | Average $102,254 |
| Welsh | 43.3 /100 | #178 | Average $102,151 |
| South Americans | 39.7 /100 | #179 | Fair $101,856 |
| French Canadians | 37.0 /100 | #180 | Fair $101,634 |
| Spaniards | 36.8 /100 | #181 | Fair $101,617 |
| Tsimshian | 35.9 /100 | #182 | Fair $101,543 |
| Kenyans | 34.5 /100 | #183 | Fair $101,417 |
| Immigrants | Costa Rica | 33.7 /100 | #184 | Fair $101,354 |
| Dutch | 31.9 /100 | #185 | Fair $101,192 |
| Celtics | 31.3 /100 | #186 | Fair $101,139 |
| Tlingit-Haida | 30.8 /100 | #187 | Fair $101,092 |
| Guamanians/Chamorros | 30.5 /100 | #188 | Fair $101,061 |
| Immigrants | Portugal | 29.6 /100 | #189 | Fair $100,984 |
| Immigrants | Immigrants | 29.4 /100 | #190 | Fair $100,962 |