Bhutanese vs Immigrants from Somalia Median Family Income
COMPARE
Bhutanese
Immigrants from Somalia
Median Family Income
Median Family Income Comparison
Bhutanese
Immigrants from Somalia
$119,800
MEDIAN FAMILY INCOME
100.0/ 100
METRIC RATING
33rd/ 347
METRIC RANK
$92,609
MEDIAN FAMILY INCOME
0.6/ 100
METRIC RATING
251st/ 347
METRIC RANK
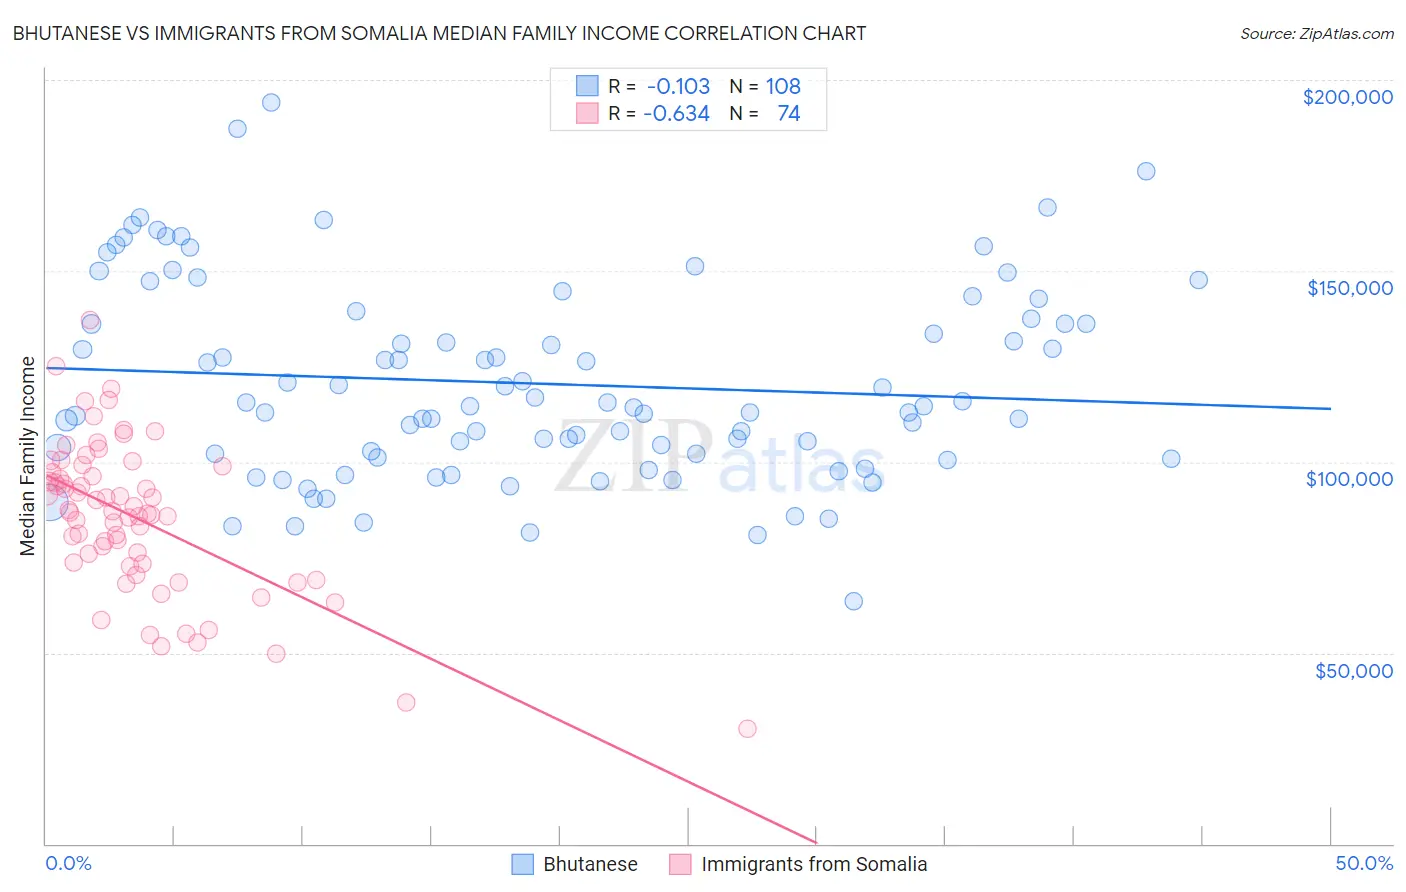
Bhutanese vs Immigrants from Somalia Median Family Income Correlation Chart
The statistical analysis conducted on geographies consisting of 454,953,353 people shows a poor negative correlation between the proportion of Bhutanese and median family income in the United States with a correlation coefficient (R) of -0.103 and weighted average of $119,800. Similarly, the statistical analysis conducted on geographies consisting of 92,093,839 people shows a significant negative correlation between the proportion of Immigrants from Somalia and median family income in the United States with a correlation coefficient (R) of -0.634 and weighted average of $92,609, a difference of 29.4%.
Median Family Income Correlation Summary
| Measurement | Bhutanese | Immigrants from Somalia |
| Minimum | $63,382 | $29,978 |
| Maximum | $194,165 | $137,115 |
| Range | $130,783 | $107,137 |
| Mean | $120,532 | $85,390 |
| Median | $114,614 | $86,897 |
| Interquartile 25% (IQ1) | $101,662 | $73,310 |
| Interquartile 75% (IQ3) | $136,845 | $97,167 |
| Interquartile Range (IQR) | $35,183 | $23,857 |
| Standard Deviation (Sample) | $25,704 | $19,854 |
| Standard Deviation (Population) | $25,585 | $19,720 |
Similar Demographics by Median Family Income
Demographics Similar to Bhutanese by Median Family Income
In terms of median family income, the demographic groups most similar to Bhutanese are Asian ($119,955, a difference of 0.13%), Immigrants from France ($120,076, a difference of 0.23%), Bolivian ($119,479, a difference of 0.27%), Immigrants from Sri Lanka ($120,263, a difference of 0.39%), and Latvian ($120,301, a difference of 0.42%).
| Demographics | Rating | Rank | Median Family Income |
| Immigrants | Switzerland | 100.0 /100 | #26 | Exceptional $120,726 |
| Russians | 100.0 /100 | #27 | Exceptional $120,487 |
| Immigrants | Denmark | 100.0 /100 | #28 | Exceptional $120,445 |
| Latvians | 100.0 /100 | #29 | Exceptional $120,301 |
| Immigrants | Sri Lanka | 100.0 /100 | #30 | Exceptional $120,263 |
| Immigrants | France | 100.0 /100 | #31 | Exceptional $120,076 |
| Asians | 100.0 /100 | #32 | Exceptional $119,955 |
| Bhutanese | 100.0 /100 | #33 | Exceptional $119,800 |
| Bolivians | 100.0 /100 | #34 | Exceptional $119,479 |
| Soviet Union | 100.0 /100 | #35 | Exceptional $119,262 |
| Israelis | 100.0 /100 | #36 | Exceptional $118,577 |
| Australians | 100.0 /100 | #37 | Exceptional $118,440 |
| Immigrants | Turkey | 100.0 /100 | #38 | Exceptional $118,325 |
| Immigrants | Asia | 100.0 /100 | #39 | Exceptional $118,291 |
| Immigrants | Lithuania | 100.0 /100 | #40 | Exceptional $118,053 |
Demographics Similar to Immigrants from Somalia by Median Family Income
In terms of median family income, the demographic groups most similar to Immigrants from Somalia are Immigrants from El Salvador ($92,545, a difference of 0.070%), Immigrants from Guyana ($92,513, a difference of 0.10%), West Indian ($92,765, a difference of 0.17%), Immigrants from Barbados ($92,419, a difference of 0.21%), and Immigrants from Ecuador ($92,837, a difference of 0.25%).
| Demographics | Rating | Rank | Median Family Income |
| Sub-Saharan Africans | 1.0 /100 | #244 | Tragic $93,748 |
| Immigrants | Middle Africa | 1.0 /100 | #245 | Tragic $93,593 |
| Guyanese | 0.9 /100 | #246 | Tragic $93,373 |
| Immigrants | Senegal | 0.7 /100 | #247 | Tragic $92,912 |
| French American Indians | 0.7 /100 | #248 | Tragic $92,872 |
| Immigrants | Ecuador | 0.7 /100 | #249 | Tragic $92,837 |
| West Indians | 0.6 /100 | #250 | Tragic $92,765 |
| Immigrants | Somalia | 0.6 /100 | #251 | Tragic $92,609 |
| Immigrants | El Salvador | 0.6 /100 | #252 | Tragic $92,545 |
| Immigrants | Guyana | 0.6 /100 | #253 | Tragic $92,513 |
| Immigrants | Barbados | 0.5 /100 | #254 | Tragic $92,419 |
| Immigrants | Laos | 0.5 /100 | #255 | Tragic $92,239 |
| Nicaraguans | 0.5 /100 | #256 | Tragic $92,231 |
| Americans | 0.4 /100 | #257 | Tragic $92,096 |
| Osage | 0.4 /100 | #258 | Tragic $91,926 |