Ute vs Kenyan Median Family Income
COMPARE
Ute
Kenyan
Median Family Income
Median Family Income Comparison
Ute
Kenyans
$87,596
MEDIAN FAMILY INCOME
0.0/ 100
METRIC RATING
293rd/ 347
METRIC RANK
$101,417
MEDIAN FAMILY INCOME
34.5/ 100
METRIC RATING
183rd/ 347
METRIC RANK
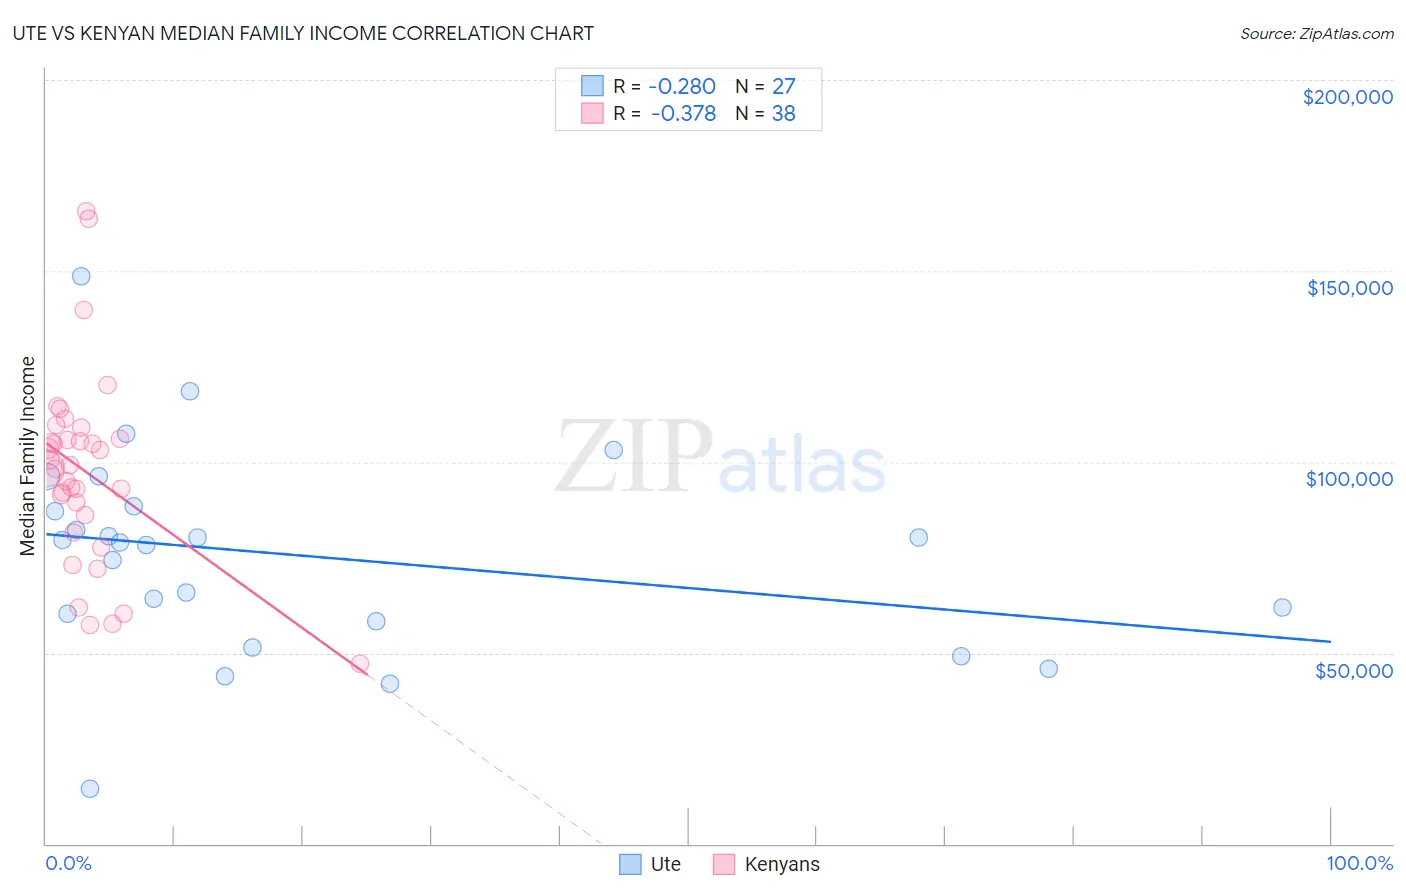
Ute vs Kenyan Median Family Income Correlation Chart
The statistical analysis conducted on geographies consisting of 55,656,168 people shows a weak negative correlation between the proportion of Ute and median family income in the United States with a correlation coefficient (R) of -0.280 and weighted average of $87,596. Similarly, the statistical analysis conducted on geographies consisting of 168,122,613 people shows a mild negative correlation between the proportion of Kenyans and median family income in the United States with a correlation coefficient (R) of -0.378 and weighted average of $101,417, a difference of 15.8%.
Median Family Income Correlation Summary
| Measurement | Ute | Kenyan |
| Minimum | $14,519 | $47,000 |
| Maximum | $148,724 | $165,640 |
| Range | $134,205 | $118,640 |
| Mean | $75,455 | $97,471 |
| Median | $78,980 | $98,633 |
| Interquartile 25% (IQ1) | $58,333 | $86,023 |
| Interquartile 75% (IQ3) | $88,500 | $106,111 |
| Interquartile Range (IQR) | $30,167 | $20,088 |
| Standard Deviation (Sample) | $27,197 | $25,158 |
| Standard Deviation (Population) | $26,688 | $24,824 |
Similar Demographics by Median Family Income
Demographics Similar to Ute by Median Family Income
In terms of median family income, the demographic groups most similar to Ute are Fijian ($87,387, a difference of 0.24%), African ($87,820, a difference of 0.26%), Immigrants from Cabo Verde ($87,830, a difference of 0.27%), Shoshone ($87,872, a difference of 0.32%), and Yaqui ($87,289, a difference of 0.35%).
| Demographics | Rating | Rank | Median Family Income |
| Immigrants | Nicaragua | 0.1 /100 | #286 | Tragic $88,267 |
| Potawatomi | 0.1 /100 | #287 | Tragic $88,265 |
| Cherokee | 0.1 /100 | #288 | Tragic $88,209 |
| Central American Indians | 0.1 /100 | #289 | Tragic $88,034 |
| Shoshone | 0.1 /100 | #290 | Tragic $87,872 |
| Immigrants | Cabo Verde | 0.1 /100 | #291 | Tragic $87,830 |
| Africans | 0.1 /100 | #292 | Tragic $87,820 |
| Ute | 0.0 /100 | #293 | Tragic $87,596 |
| Fijians | 0.0 /100 | #294 | Tragic $87,387 |
| Yaqui | 0.0 /100 | #295 | Tragic $87,289 |
| Immigrants | Guatemala | 0.0 /100 | #296 | Tragic $87,191 |
| Cajuns | 0.0 /100 | #297 | Tragic $87,157 |
| Immigrants | Latin America | 0.0 /100 | #298 | Tragic $86,989 |
| Chippewa | 0.0 /100 | #299 | Tragic $86,852 |
| Ottawa | 0.0 /100 | #300 | Tragic $86,380 |
Demographics Similar to Kenyans by Median Family Income
In terms of median family income, the demographic groups most similar to Kenyans are Immigrants from Costa Rica ($101,354, a difference of 0.060%), Tsimshian ($101,543, a difference of 0.12%), Spaniard ($101,617, a difference of 0.20%), French Canadian ($101,634, a difference of 0.21%), and Dutch ($101,192, a difference of 0.22%).
| Demographics | Rating | Rank | Median Family Income |
| French | 46.1 /100 | #176 | Average $102,368 |
| Germans | 44.6 /100 | #177 | Average $102,254 |
| Welsh | 43.3 /100 | #178 | Average $102,151 |
| South Americans | 39.7 /100 | #179 | Fair $101,856 |
| French Canadians | 37.0 /100 | #180 | Fair $101,634 |
| Spaniards | 36.8 /100 | #181 | Fair $101,617 |
| Tsimshian | 35.9 /100 | #182 | Fair $101,543 |
| Kenyans | 34.5 /100 | #183 | Fair $101,417 |
| Immigrants | Costa Rica | 33.7 /100 | #184 | Fair $101,354 |
| Dutch | 31.9 /100 | #185 | Fair $101,192 |
| Celtics | 31.3 /100 | #186 | Fair $101,139 |
| Tlingit-Haida | 30.8 /100 | #187 | Fair $101,092 |
| Guamanians/Chamorros | 30.5 /100 | #188 | Fair $101,061 |
| Immigrants | Portugal | 29.6 /100 | #189 | Fair $100,984 |
| Immigrants | Immigrants | 29.4 /100 | #190 | Fair $100,962 |