Bhutanese vs Immigrants from Syria Median Family Income
COMPARE
Bhutanese
Immigrants from Syria
Median Family Income
Median Family Income Comparison
Bhutanese
Immigrants from Syria
$119,800
MEDIAN FAMILY INCOME
100.0/ 100
METRIC RATING
33rd/ 347
METRIC RANK
$106,118
MEDIAN FAMILY INCOME
85.3/ 100
METRIC RATING
141st/ 347
METRIC RANK
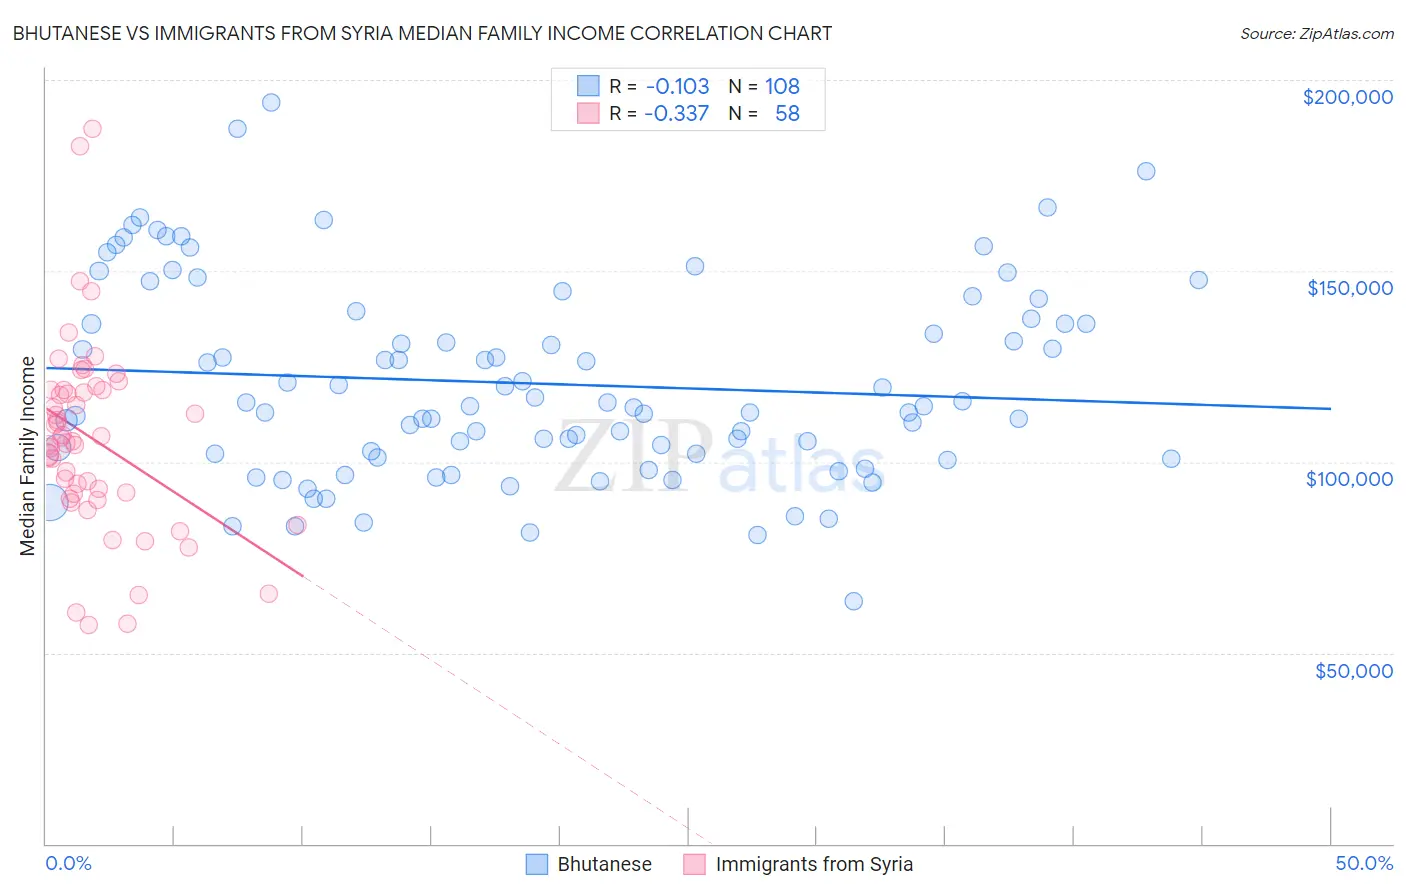
Bhutanese vs Immigrants from Syria Median Family Income Correlation Chart
The statistical analysis conducted on geographies consisting of 454,953,353 people shows a poor negative correlation between the proportion of Bhutanese and median family income in the United States with a correlation coefficient (R) of -0.103 and weighted average of $119,800. Similarly, the statistical analysis conducted on geographies consisting of 174,073,283 people shows a mild negative correlation between the proportion of Immigrants from Syria and median family income in the United States with a correlation coefficient (R) of -0.337 and weighted average of $106,118, a difference of 12.9%.
Median Family Income Correlation Summary
| Measurement | Bhutanese | Immigrants from Syria |
| Minimum | $63,382 | $57,198 |
| Maximum | $194,165 | $187,321 |
| Range | $130,783 | $130,123 |
| Mean | $120,532 | $106,113 |
| Median | $114,614 | $105,890 |
| Interquartile 25% (IQ1) | $101,662 | $91,647 |
| Interquartile 75% (IQ3) | $136,845 | $118,687 |
| Interquartile Range (IQR) | $35,183 | $27,040 |
| Standard Deviation (Sample) | $25,704 | $25,104 |
| Standard Deviation (Population) | $25,585 | $24,886 |
Similar Demographics by Median Family Income
Demographics Similar to Bhutanese by Median Family Income
In terms of median family income, the demographic groups most similar to Bhutanese are Asian ($119,955, a difference of 0.13%), Immigrants from France ($120,076, a difference of 0.23%), Bolivian ($119,479, a difference of 0.27%), Immigrants from Sri Lanka ($120,263, a difference of 0.39%), and Latvian ($120,301, a difference of 0.42%).
| Demographics | Rating | Rank | Median Family Income |
| Immigrants | Switzerland | 100.0 /100 | #26 | Exceptional $120,726 |
| Russians | 100.0 /100 | #27 | Exceptional $120,487 |
| Immigrants | Denmark | 100.0 /100 | #28 | Exceptional $120,445 |
| Latvians | 100.0 /100 | #29 | Exceptional $120,301 |
| Immigrants | Sri Lanka | 100.0 /100 | #30 | Exceptional $120,263 |
| Immigrants | France | 100.0 /100 | #31 | Exceptional $120,076 |
| Asians | 100.0 /100 | #32 | Exceptional $119,955 |
| Bhutanese | 100.0 /100 | #33 | Exceptional $119,800 |
| Bolivians | 100.0 /100 | #34 | Exceptional $119,479 |
| Soviet Union | 100.0 /100 | #35 | Exceptional $119,262 |
| Israelis | 100.0 /100 | #36 | Exceptional $118,577 |
| Australians | 100.0 /100 | #37 | Exceptional $118,440 |
| Immigrants | Turkey | 100.0 /100 | #38 | Exceptional $118,325 |
| Immigrants | Asia | 100.0 /100 | #39 | Exceptional $118,291 |
| Immigrants | Lithuania | 100.0 /100 | #40 | Exceptional $118,053 |
Demographics Similar to Immigrants from Syria by Median Family Income
In terms of median family income, the demographic groups most similar to Immigrants from Syria are Norwegian ($106,144, a difference of 0.020%), Immigrants from Vietnam ($106,186, a difference of 0.060%), Luxembourger ($106,183, a difference of 0.060%), Immigrants from Uganda ($106,188, a difference of 0.070%), and Slovene ($106,020, a difference of 0.090%).
| Demographics | Rating | Rank | Median Family Income |
| Immigrants | Oceania | 87.3 /100 | #134 | Excellent $106,453 |
| Portuguese | 86.3 /100 | #135 | Excellent $106,286 |
| Immigrants | South Eastern Asia | 86.1 /100 | #136 | Excellent $106,252 |
| Immigrants | Uganda | 85.7 /100 | #137 | Excellent $106,188 |
| Immigrants | Vietnam | 85.7 /100 | #138 | Excellent $106,186 |
| Luxembourgers | 85.7 /100 | #139 | Excellent $106,183 |
| Norwegians | 85.5 /100 | #140 | Excellent $106,144 |
| Immigrants | Syria | 85.3 /100 | #141 | Excellent $106,118 |
| Slovenes | 84.7 /100 | #142 | Excellent $106,020 |
| Tongans | 84.3 /100 | #143 | Excellent $105,967 |
| Immigrants | Morocco | 84.3 /100 | #144 | Excellent $105,964 |
| Danes | 83.8 /100 | #145 | Excellent $105,900 |
| Czechs | 83.4 /100 | #146 | Excellent $105,839 |
| Immigrants | Chile | 82.1 /100 | #147 | Excellent $105,655 |
| Hungarians | 81.7 /100 | #148 | Excellent $105,609 |