Bhutanese vs Kenyan Divorced or Separated
COMPARE
Bhutanese
Kenyan
Divorced or Separated
Divorced or Separated Comparison
Bhutanese
Kenyans
11.2%
DIVORCED OR SEPARATED
100.0/ 100
METRIC RATING
41st/ 347
METRIC RANK
12.2%
DIVORCED OR SEPARATED
21.8/ 100
METRIC RATING
204th/ 347
METRIC RANK
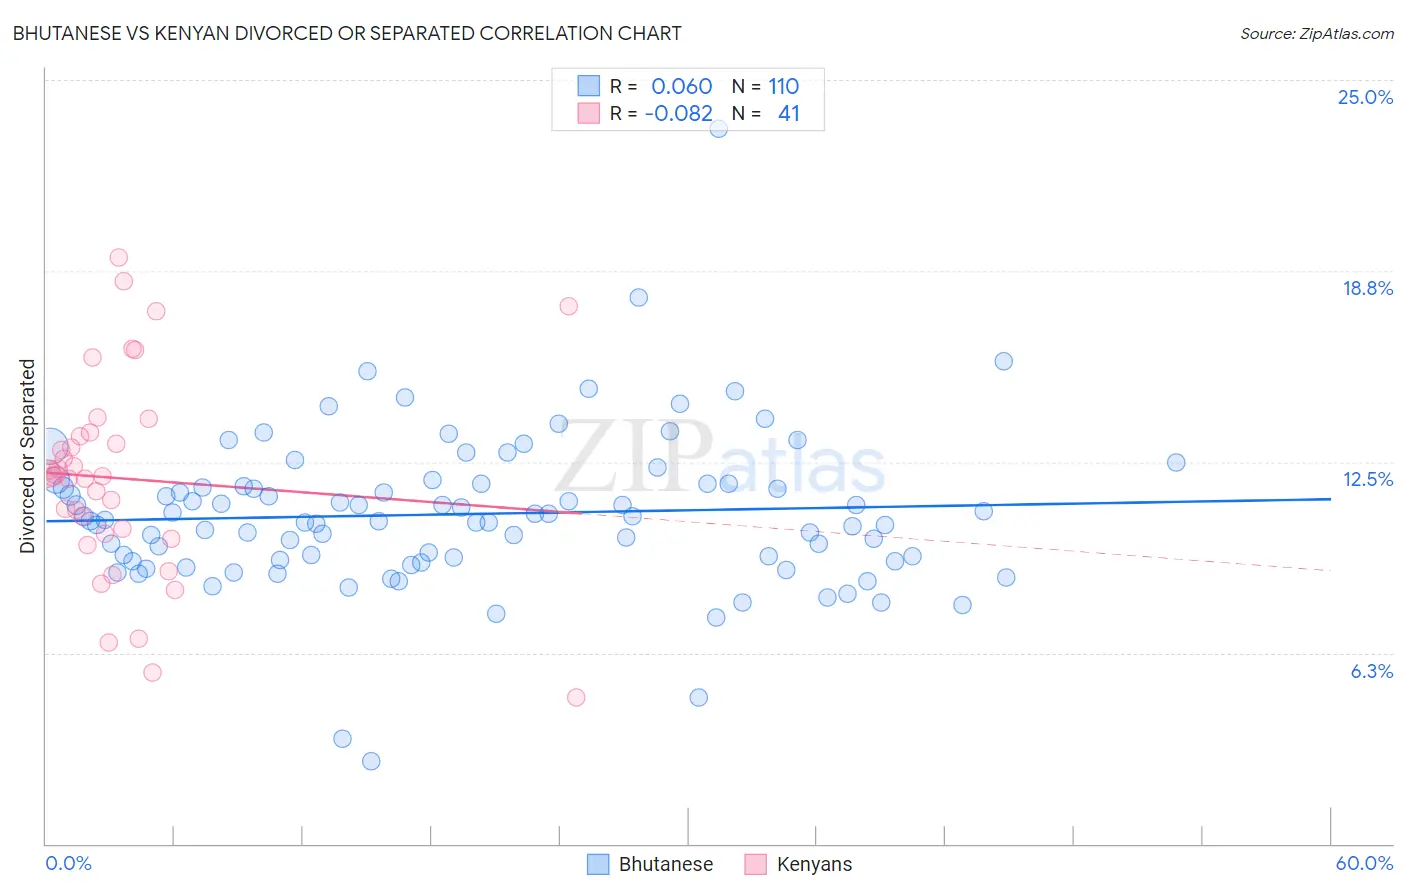
Bhutanese vs Kenyan Divorced or Separated Correlation Chart
The statistical analysis conducted on geographies consisting of 455,285,816 people shows a slight positive correlation between the proportion of Bhutanese and percentage of population currently divorced or separated in the United States with a correlation coefficient (R) of 0.060 and weighted average of 11.2%. Similarly, the statistical analysis conducted on geographies consisting of 168,184,895 people shows a slight negative correlation between the proportion of Kenyans and percentage of population currently divorced or separated in the United States with a correlation coefficient (R) of -0.082 and weighted average of 12.2%, a difference of 9.0%.
Divorced or Separated Correlation Summary
| Measurement | Bhutanese | Kenyan |
| Minimum | 2.7% | 4.8% |
| Maximum | 23.4% | 19.2% |
| Range | 20.7% | 14.4% |
| Mean | 10.8% | 11.9% |
| Median | 10.6% | 12.0% |
| Interquartile 25% (IQ1) | 9.3% | 10.1% |
| Interquartile 75% (IQ3) | 11.8% | 13.4% |
| Interquartile Range (IQR) | 2.5% | 3.3% |
| Standard Deviation (Sample) | 2.6% | 3.3% |
| Standard Deviation (Population) | 2.6% | 3.3% |
Similar Demographics by Divorced or Separated
Demographics Similar to Bhutanese by Divorced or Separated
In terms of divorced or separated, the demographic groups most similar to Bhutanese are Chinese (11.2%, a difference of 0.060%), Immigrants from Belarus (11.2%, a difference of 0.070%), Immigrants from Western Asia (11.2%, a difference of 0.090%), Turkish (11.2%, a difference of 0.13%), and Laotian (11.2%, a difference of 0.24%).
| Demographics | Rating | Rank | Divorced or Separated |
| Immigrants | Uzbekistan | 100.0 /100 | #34 | Exceptional 11.1% |
| Cambodians | 100.0 /100 | #35 | Exceptional 11.1% |
| Immigrants | Japan | 100.0 /100 | #36 | Exceptional 11.1% |
| Immigrants | Lebanon | 100.0 /100 | #37 | Exceptional 11.1% |
| Immigrants | Greece | 100.0 /100 | #38 | Exceptional 11.1% |
| Immigrants | Egypt | 100.0 /100 | #39 | Exceptional 11.1% |
| Soviet Union | 100.0 /100 | #40 | Exceptional 11.1% |
| Bhutanese | 100.0 /100 | #41 | Exceptional 11.2% |
| Chinese | 100.0 /100 | #42 | Exceptional 11.2% |
| Immigrants | Belarus | 100.0 /100 | #43 | Exceptional 11.2% |
| Immigrants | Western Asia | 100.0 /100 | #44 | Exceptional 11.2% |
| Turks | 100.0 /100 | #45 | Exceptional 11.2% |
| Laotians | 100.0 /100 | #46 | Exceptional 11.2% |
| Immigrants | Poland | 100.0 /100 | #47 | Exceptional 11.2% |
| Immigrants | Turkey | 100.0 /100 | #48 | Exceptional 11.2% |
Demographics Similar to Kenyans by Divorced or Separated
In terms of divorced or separated, the demographic groups most similar to Kenyans are Immigrants from Costa Rica (12.2%, a difference of 0.030%), Slovak (12.2%, a difference of 0.040%), Mexican (12.2%, a difference of 0.040%), Immigrants from Guatemala (12.2%, a difference of 0.070%), and Portuguese (12.2%, a difference of 0.080%).
| Demographics | Rating | Rank | Divorced or Separated |
| Immigrants | Africa | 30.3 /100 | #197 | Fair 12.1% |
| Nigerians | 30.1 /100 | #198 | Fair 12.1% |
| Central Americans | 29.4 /100 | #199 | Fair 12.1% |
| South Americans | 28.6 /100 | #200 | Fair 12.2% |
| Guatemalans | 26.9 /100 | #201 | Fair 12.2% |
| Portuguese | 23.5 /100 | #202 | Fair 12.2% |
| Immigrants | Guatemala | 23.2 /100 | #203 | Fair 12.2% |
| Kenyans | 21.8 /100 | #204 | Fair 12.2% |
| Immigrants | Costa Rica | 21.3 /100 | #205 | Fair 12.2% |
| Slovaks | 21.0 /100 | #206 | Fair 12.2% |
| Mexicans | 21.0 /100 | #207 | Fair 12.2% |
| Immigrants | Ghana | 18.8 /100 | #208 | Poor 12.2% |
| Immigrants | Trinidad and Tobago | 17.8 /100 | #209 | Poor 12.2% |
| Slavs | 17.0 /100 | #210 | Poor 12.2% |
| Trinidadians and Tobagonians | 16.6 /100 | #211 | Poor 12.2% |