Bhutanese vs Immigrants from Scotland Median Family Income

COMPARE

Bhutanese
Race
Ancestry
AfghanAfricanAlaska NativeAlaskan AthabascanAlbanianAleutAlsatianAmericanApacheArabArapahoArgentineanArmenianAssyrian/Chaldean/SyriacAustralianAustrianBahamianBangladeshiBarbadianBasqueBelgianBelizeanBermudanBhutaneseBlackfeetBolivianBrazilianBritishBritish West IndianBulgarianBurmeseCajunCambodianCanadianCape VerdeanCarpatho RusynCelticCentral AmericanCentral American IndianCherokeeCheyenneChickasawChileanChineseChippewaChoctawColombianColvilleComancheCosta RicanCreeCreekCroatianCrowCubanCypriotCzechCzechoslovakianDanishDelawareDominicanDutchDutch West IndianEastern EuropeanEcuadorianEgyptianEnglishEstonianEthiopianEuropeanFijianFilipinoFinnishFrenchFrench American IndianFrench CanadianGermanGerman RussianGhanaianGreekGuamanian/ChamorroGuatemalanGuyaneseHaitianHmongHonduranHopiHoumaHungarianIcelanderIndian (Asian)IndonesianInupiatIranianIraqiIrishIroquoisIsraeliItalianJamaicanJapaneseJordanianKenyanKiowaKoreanLaotianLatvianLebaneseLiberianLithuanianLumbeeLuxembourgerMacedonianMalaysianMalteseMarshalleseMenomineeMexicanMexican American IndianMongolianMoroccanNative HawaiianNavajoNepaleseNew ZealanderNicaraguanNigerianNorthern EuropeanNorwegianOkinawanOsageOttawaPaiutePakistaniPalestinianPanamanianParaguayanPennsylvania GermanPeruvianPimaPolishPortuguesePotawatomiPuebloPuerto RicanPuget Sound SalishRomanianRussianSalvadoranSamoanScandinavianScotch-IrishScottishSeminoleSenegaleseSerbianShoshoneSierra LeoneanSiouxSlavicSlovakSloveneSomaliSouth AfricanSouth AmericanSouth American IndianSoviet UnionSpaniardSpanishSpanish AmericanSpanish American IndianSri LankanSubsaharan AfricanSudaneseSwedishSwissSyrianTaiwaneseThaiTlingit-HaidaTohono O'OdhamTonganTrinidadian and TobagonianTsimshianTurkishU.S. Virgin IslanderUgandanUkrainianUruguayanUteVenezuelanVietnameseWelshWest IndianYakamaYaquiYugoslavianYumanYup'ikZimbabwean
Immigration
NonimmigrantsImmigrantsAfghanistanAfricaAlbaniaArgentinaArmeniaAsiaAustraliaAustriaBahamasBangladeshBarbadosBelarusBelgiumBelizeBoliviaBosnia and HerzegovinaBrazilBulgariaBurma/MyanmarCabo VerdeCambodiaCameroonCanadaCaribbeanCentral AmericaChileChinaColombiaCongoCosta RicaCroatiaCubaCzechoslovakiaDenmarkDominicaDominican RepublicEastern AfricaEastern AsiaEastern EuropeEcuadorEgyptEl SalvadorEnglandEritreaEthiopiaEuropeFijiFranceGermanyGhanaGreeceGrenadaGuatemalaGuyanaHaitiHondurasHong KongHungaryIndiaIndonesiaIranIraqIrelandIsraelItalyJamaicaJapanJordanKazakhstanKenyaKoreaKuwaitLaosLatin AmericaLatviaLebanonLiberiaLithuaniaMalaysiaMexicoMicronesiaMiddle AfricaMoldovaMoroccoNepalNetherlandsNicaraguaNigeriaNorth AmericaNorth MacedoniaNorthern AfricaNorthern EuropeNorwayOceaniaPakistanPanamaPeruPhilippinesPolandPortugalRomaniaRussiaSaudi ArabiaSenegalSerbiaSierra LeoneSingaporeSomaliaSouth AfricaSouth AmericaSouth Central AsiaSouth Eastern AsiaSouthern EuropeSpainSri LankaSt. Vincent and the GrenadinesSudanSwedenSwitzerlandSyriaTaiwanThailandTrinidad and TobagoTurkeyUgandaUkraineUruguayUzbekistanVenezuelaVietnamWest IndiesWestern AfricaWestern AsiaWestern EuropeYemenZaireZimbabweAzores
Immigrants from Scotland
Race
Ancestry
AfghanAfricanAlaska NativeAlaskan AthabascanAlbanianAleutAlsatianAmericanApacheArabArapahoArgentineanArmenianAssyrian/Chaldean/SyriacAustralianAustrianBahamianBangladeshiBarbadianBasqueBelgianBelizeanBermudanBlackfeetBolivianBrazilianBritishBritish West IndianBulgarianBurmeseCajunCambodianCanadianCape VerdeanCarpatho RusynCelticCentral AmericanCentral American IndianCherokeeCheyenneChickasawChileanChineseChippewaChoctawColombianColvilleComancheCosta RicanCreeCreekCroatianCrowCubanCypriotCzechCzechoslovakianDanishDelawareDominicanDutchDutch West IndianEastern EuropeanEcuadorianEgyptianEnglishEstonianEthiopianEuropeanFijianFilipinoFinnishFrenchFrench American IndianFrench CanadianGermanGerman RussianGhanaianGreekGuamanian/ChamorroGuatemalanGuyaneseHaitianHmongHonduranHopiHoumaHungarianIcelanderIndian (Asian)IndonesianInupiatIranianIraqiIrishIroquoisIsraeliItalianJamaicanJapaneseJordanianKenyanKiowaKoreanLaotianLatvianLebaneseLiberianLithuanianLumbeeLuxembourgerMacedonianMalaysianMalteseMarshalleseMenomineeMexicanMexican American IndianMongolianMoroccanNative HawaiianNavajoNepaleseNew ZealanderNicaraguanNigerianNorthern EuropeanNorwegianOkinawanOsageOttawaPaiutePakistaniPalestinianPanamanianParaguayanPennsylvania GermanPeruvianPimaPolishPortuguesePotawatomiPuebloPuerto RicanPuget Sound SalishRomanianRussianSalvadoranSamoanScandinavianScotch-IrishScottishSeminoleSenegaleseSerbianShoshoneSierra LeoneanSiouxSlavicSlovakSloveneSomaliSouth AfricanSouth AmericanSouth American IndianSoviet UnionSpaniardSpanishSpanish AmericanSpanish American IndianSri LankanSubsaharan AfricanSudaneseSwedishSwissSyrianTaiwaneseThaiTlingit-HaidaTohono O'OdhamTonganTrinidadian and TobagonianTsimshianTurkishU.S. Virgin IslanderUgandanUkrainianUruguayanUteVenezuelanVietnameseWelshWest IndianYakamaYaquiYugoslavianYumanYup'ikZimbabwean
Immigration
NonimmigrantsImmigrantsAfghanistanAfricaAlbaniaArgentinaArmeniaAsiaAustraliaAustriaBahamasBangladeshBarbadosBelarusBelgiumBelizeBoliviaBosnia and HerzegovinaBrazilBulgariaBurma/MyanmarCabo VerdeCambodiaCameroonCanadaCaribbeanCentral AmericaChileChinaColombiaCongoCosta RicaCroatiaCubaCzechoslovakiaDenmarkDominicaDominican RepublicEastern AfricaEastern AsiaEastern EuropeEcuadorEgyptEl SalvadorEnglandEritreaEthiopiaEuropeFijiFranceGermanyGhanaGreeceGrenadaGuatemalaGuyanaHaitiHondurasHong KongHungaryIndiaIndonesiaIranIraqIrelandIsraelItalyJamaicaJapanJordanKazakhstanKenyaKoreaKuwaitLaosLatin AmericaLatviaLebanonLiberiaLithuaniaMalaysiaMexicoMicronesiaMiddle AfricaMoldovaMoroccoNepalNetherlandsNicaraguaNigeriaNorth AmericaNorth MacedoniaNorthern AfricaNorthern EuropeNorwayOceaniaPakistanPanamaPeruPhilippinesPolandPortugalRomaniaRussiaSaudi ArabiaScotlandSenegalSerbiaSierra LeoneSingaporeSomaliaSouth AfricaSouth AmericaSouth Central AsiaSouth Eastern AsiaSouthern EuropeSpainSri LankaSt. Vincent and the GrenadinesSudanSwedenSwitzerlandSyriaTaiwanThailandTrinidad and TobagoTurkeyUgandaUkraineUruguayUzbekistanVenezuelaVietnamWest IndiesWestern AfricaWestern AsiaWestern EuropeYemenZaireZimbabweAzores
Median Family Income
Income
Poverty
Unemployment
Labor Participation
Family Structure
Vehicle Availability
Education Level
Disability

Median Family Income Comparison

Bhutanese

Immigrants from Scotland

Exceptional
Exceptional
$119,800
MEDIAN FAMILY INCOME
100.0/ 100
METRIC RATING
33rd/ 347
METRIC RANK
$114,392
MEDIAN FAMILY INCOME
99.7/ 100
METRIC RATING
64th/ 347
METRIC RANK

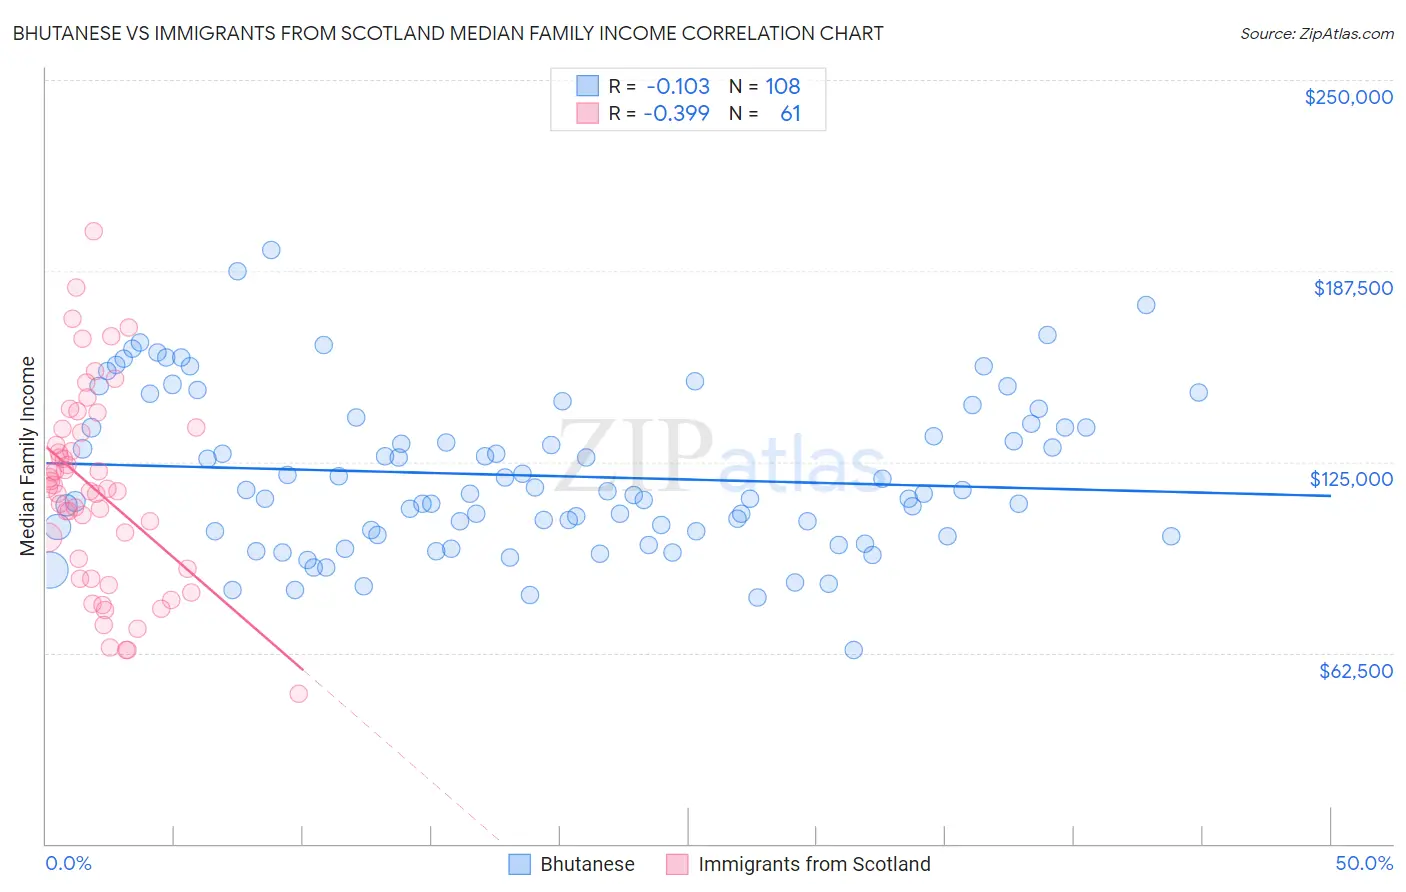
Bhutanese vs Immigrants from Scotland Median Family Income Correlation Chart

The statistical analysis conducted on geographies consisting of 454,953,353 people shows a poor negative correlation between the proportion of Bhutanese and median family income in the United States with a correlation coefficient (R) of -0.103 and weighted average of $119,800. Similarly, the statistical analysis conducted on geographies consisting of 196,366,880 people shows a mild negative correlation between the proportion of Immigrants from Scotland and median family income in the United States with a correlation coefficient (R) of -0.399 and weighted average of $114,392, a difference of 4.7%.
Bhutanese vs Immigrants from Scotland Median Family Income

Median Family Income Correlation Summary

MeasurementBhutaneseImmigrants from Scotland
Minimum$63,382$48,950
Maximum$194,165$200,376
Range$130,783$151,426
Mean$120,532$115,583
Median$114,614$116,250
Interquartile 25% (IQ1)$101,662$88,375
Interquartile 75% (IQ3)$136,845$135,291
Interquartile Range (IQR)$35,183$46,916
Standard Deviation (Sample)$25,704$31,941
Standard Deviation (Population)$25,585$31,678

Similar Demographics by Median Family Income

Demographics Similar to Bhutanese by Median Family Income

In terms of median family income, the demographic groups most similar to Bhutanese are Asian ($119,955, a difference of 0.13%), Immigrants from France ($120,076, a difference of 0.23%), Bolivian ($119,479, a difference of 0.27%), Immigrants from Sri Lanka ($120,263, a difference of 0.39%), and Latvian ($120,301, a difference of 0.42%).
DemographicsRating | RankMedian Family Income
Immigrants | Switzerland
100.0
/100
|
#26
Exceptional
$120,726
Russians
100.0
/100
|
#27
Exceptional
$120,487
Immigrants | Denmark
100.0
/100
|
#28
Exceptional
$120,445
Latvians
100.0
/100
|
#29
Exceptional
$120,301
Immigrants | Sri Lanka
100.0
/100
|
#30
Exceptional
$120,263
Immigrants | France
100.0
/100
|
#31
Exceptional
$120,076
Asians
100.0
/100
|
#32
Exceptional
$119,955
Bhutanese
100.0
/100
|
#33
Exceptional
$119,800
Bolivians
100.0
/100
|
#34
Exceptional
$119,479
Soviet Union
100.0
/100
|
#35
Exceptional
$119,262
Israelis
100.0
/100
|
#36
Exceptional
$118,577
Australians
100.0
/100
|
#37
Exceptional
$118,440
Immigrants | Turkey
100.0
/100
|
#38
Exceptional
$118,325
Immigrants | Asia
100.0
/100
|
#39
Exceptional
$118,291
Immigrants | Lithuania
100.0
/100
|
#40
Exceptional
$118,053

Demographics Similar to Immigrants from Scotland by Median Family Income

In terms of median family income, the demographic groups most similar to Immigrants from Scotland are Immigrants from Pakistan ($114,406, a difference of 0.010%), Mongolian ($114,553, a difference of 0.14%), Immigrants from Belarus ($114,586, a difference of 0.17%), Egyptian ($114,119, a difference of 0.24%), and Paraguayan ($114,016, a difference of 0.33%).
DemographicsRating | RankMedian Family Income
Greeks
99.8
/100
|
#57
Exceptional
$115,192
Immigrants | Indonesia
99.8
/100
|
#58
Exceptional
$115,162
Immigrants | Netherlands
99.8
/100
|
#59
Exceptional
$114,987
Immigrants | Latvia
99.8
/100
|
#60
Exceptional
$114,826
Immigrants | Belarus
99.8
/100
|
#61
Exceptional
$114,586
Mongolians
99.8
/100
|
#62
Exceptional
$114,553
Immigrants | Pakistan
99.8
/100
|
#63
Exceptional
$114,406
Immigrants | Scotland
99.7
/100
|
#64
Exceptional
$114,392
Egyptians
99.7
/100
|
#65
Exceptional
$114,119
Paraguayans
99.7
/100
|
#66
Exceptional
$114,016
Immigrants | Spain
99.7
/100
|
#67
Exceptional
$113,815
Immigrants | Serbia
99.6
/100
|
#68
Exceptional
$113,463
Immigrants | Bulgaria
99.6
/100
|
#69
Exceptional
$113,461
Immigrants | Romania
99.6
/100
|
#70
Exceptional
$113,434
South Africans
99.5
/100
|
#71
Exceptional
$113,229