Bhutanese vs Kenyan Householder Income Ages 25 - 44 years
COMPARE
Bhutanese
Kenyan
Householder Income Ages 25 - 44 years
Householder Income Ages 25 - 44 years Comparison
Bhutanese
Kenyans
$109,520
HOUSEHOLDER INCOME AGES 25 - 44 YEARS
100.0/ 100
METRIC RATING
33rd/ 347
METRIC RANK
$91,684
HOUSEHOLDER INCOME AGES 25 - 44 YEARS
16.8/ 100
METRIC RATING
199th/ 347
METRIC RANK
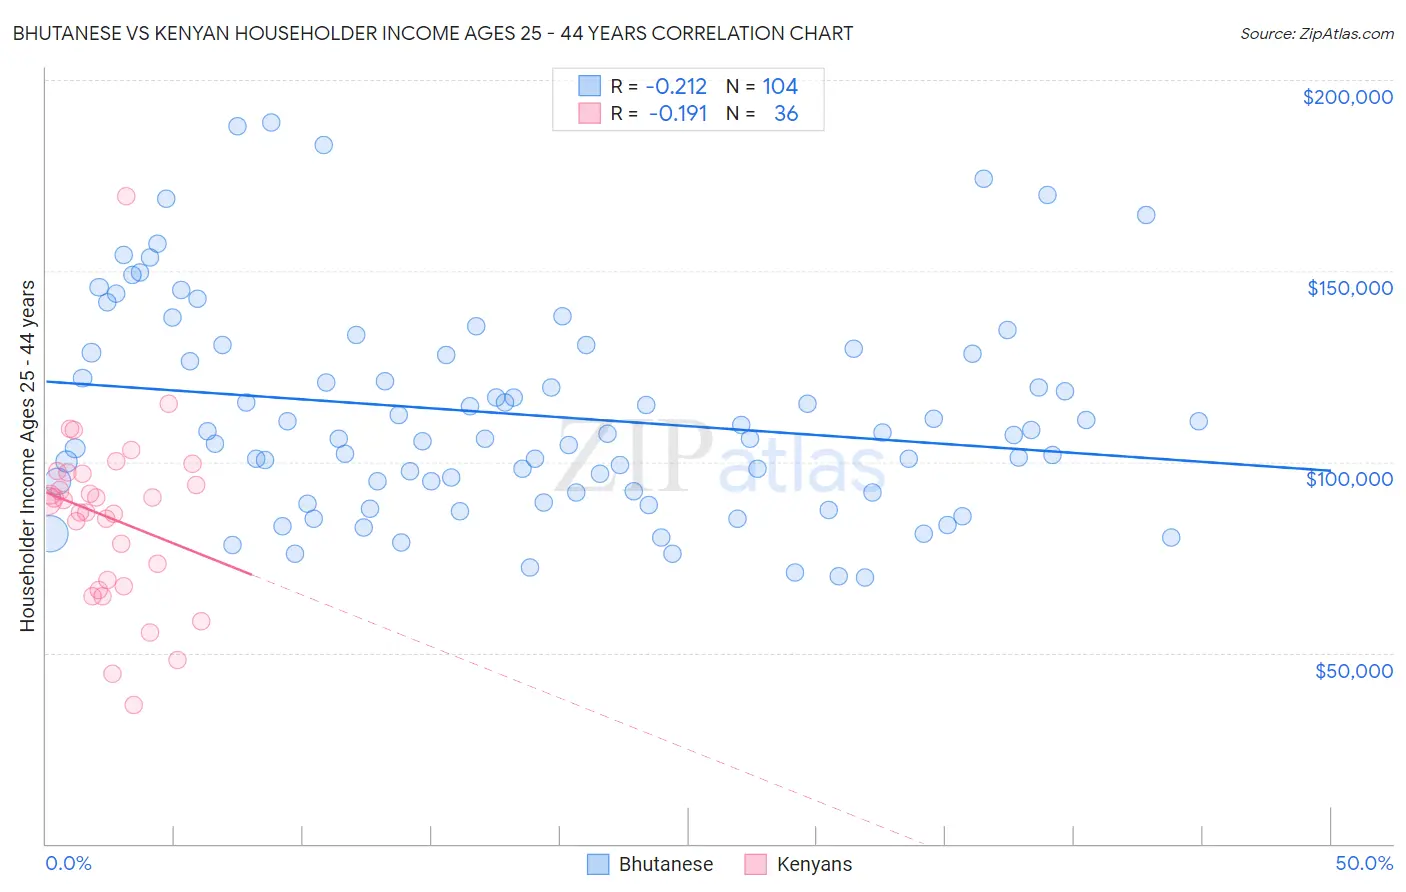
Bhutanese vs Kenyan Householder Income Ages 25 - 44 years Correlation Chart
The statistical analysis conducted on geographies consisting of 454,022,239 people shows a weak negative correlation between the proportion of Bhutanese and household income with householder between the ages 25 and 44 in the United States with a correlation coefficient (R) of -0.212 and weighted average of $109,520. Similarly, the statistical analysis conducted on geographies consisting of 168,058,710 people shows a poor negative correlation between the proportion of Kenyans and household income with householder between the ages 25 and 44 in the United States with a correlation coefficient (R) of -0.191 and weighted average of $91,684, a difference of 19.5%.
Householder Income Ages 25 - 44 years Correlation Summary
| Measurement | Bhutanese | Kenyan |
| Minimum | $69,864 | $36,414 |
| Maximum | $188,962 | $169,412 |
| Range | $119,098 | $132,998 |
| Mean | $112,280 | $85,374 |
| Median | $107,164 | $89,858 |
| Interquartile 25% (IQ1) | $92,216 | $68,236 |
| Interquartile 75% (IQ3) | $128,400 | $97,027 |
| Interquartile Range (IQR) | $36,183 | $28,791 |
| Standard Deviation (Sample) | $27,356 | $23,657 |
| Standard Deviation (Population) | $27,224 | $23,326 |
Similar Demographics by Householder Income Ages 25 - 44 years
Demographics Similar to Bhutanese by Householder Income Ages 25 - 44 years
In terms of householder income ages 25 - 44 years, the demographic groups most similar to Bhutanese are Bolivian ($109,372, a difference of 0.13%), Immigrants from Sri Lanka ($109,741, a difference of 0.20%), Immigrants from Switzerland ($109,185, a difference of 0.31%), Maltese ($110,064, a difference of 0.50%), and Immigrants from Greece ($110,103, a difference of 0.53%).
| Demographics | Rating | Rank | Householder Income Ages 25 - 44 years |
| Immigrants | Asia | 100.0 /100 | #26 | Exceptional $110,787 |
| Russians | 100.0 /100 | #27 | Exceptional $110,398 |
| Immigrants | Denmark | 100.0 /100 | #28 | Exceptional $110,363 |
| Turks | 100.0 /100 | #29 | Exceptional $110,318 |
| Immigrants | Greece | 100.0 /100 | #30 | Exceptional $110,103 |
| Maltese | 100.0 /100 | #31 | Exceptional $110,064 |
| Immigrants | Sri Lanka | 100.0 /100 | #32 | Exceptional $109,741 |
| Bhutanese | 100.0 /100 | #33 | Exceptional $109,520 |
| Bolivians | 100.0 /100 | #34 | Exceptional $109,372 |
| Immigrants | Switzerland | 100.0 /100 | #35 | Exceptional $109,185 |
| Latvians | 100.0 /100 | #36 | Exceptional $108,926 |
| Immigrants | Russia | 100.0 /100 | #37 | Exceptional $108,751 |
| Soviet Union | 100.0 /100 | #38 | Exceptional $108,457 |
| Immigrants | France | 99.9 /100 | #39 | Exceptional $108,257 |
| Immigrants | Lithuania | 99.9 /100 | #40 | Exceptional $108,149 |
Demographics Similar to Kenyans by Householder Income Ages 25 - 44 years
In terms of householder income ages 25 - 44 years, the demographic groups most similar to Kenyans are White/Caucasian ($91,668, a difference of 0.020%), Japanese ($91,624, a difference of 0.070%), Ecuadorian ($91,574, a difference of 0.12%), Immigrants from Cambodia ($91,533, a difference of 0.16%), and Nepalese ($91,498, a difference of 0.20%).
| Demographics | Rating | Rank | Householder Income Ages 25 - 44 years |
| Immigrants | Costa Rica | 28.2 /100 | #192 | Fair $92,876 |
| Samoans | 23.0 /100 | #193 | Fair $92,385 |
| Immigrants | Azores | 22.4 /100 | #194 | Fair $92,322 |
| Celtics | 21.6 /100 | #195 | Fair $92,241 |
| Immigrants | Colombia | 21.3 /100 | #196 | Fair $92,204 |
| Spanish | 21.2 /100 | #197 | Fair $92,200 |
| Vietnamese | 20.2 /100 | #198 | Fair $92,089 |
| Kenyans | 16.8 /100 | #199 | Poor $91,684 |
| Whites/Caucasians | 16.7 /100 | #200 | Poor $91,668 |
| Japanese | 16.4 /100 | #201 | Poor $91,624 |
| Ecuadorians | 16.0 /100 | #202 | Poor $91,574 |
| Immigrants | Cambodia | 15.7 /100 | #203 | Poor $91,533 |
| Nepalese | 15.4 /100 | #204 | Poor $91,498 |
| Immigrants | Eastern Africa | 15.2 /100 | #205 | Poor $91,458 |
| Aleuts | 14.5 /100 | #206 | Poor $91,370 |