Bhutanese vs Immigrants from Ireland Median Family Income

COMPARE

Bhutanese
Race
Ancestry
AfghanAfricanAlaska NativeAlaskan AthabascanAlbanianAleutAlsatianAmericanApacheArabArapahoArgentineanArmenianAssyrian/Chaldean/SyriacAustralianAustrianBahamianBangladeshiBarbadianBasqueBelgianBelizeanBermudanBhutaneseBlackfeetBolivianBrazilianBritishBritish West IndianBulgarianBurmeseCajunCambodianCanadianCape VerdeanCarpatho RusynCelticCentral AmericanCentral American IndianCherokeeCheyenneChickasawChileanChineseChippewaChoctawColombianColvilleComancheCosta RicanCreeCreekCroatianCrowCubanCypriotCzechCzechoslovakianDanishDelawareDominicanDutchDutch West IndianEastern EuropeanEcuadorianEgyptianEnglishEstonianEthiopianEuropeanFijianFilipinoFinnishFrenchFrench American IndianFrench CanadianGermanGerman RussianGhanaianGreekGuamanian/ChamorroGuatemalanGuyaneseHaitianHmongHonduranHopiHoumaHungarianIcelanderIndian (Asian)IndonesianInupiatIranianIraqiIrishIroquoisIsraeliItalianJamaicanJapaneseJordanianKenyanKiowaKoreanLaotianLatvianLebaneseLiberianLithuanianLumbeeLuxembourgerMacedonianMalaysianMalteseMarshalleseMenomineeMexicanMexican American IndianMongolianMoroccanNative HawaiianNavajoNepaleseNew ZealanderNicaraguanNigerianNorthern EuropeanNorwegianOkinawanOsageOttawaPaiutePakistaniPalestinianPanamanianParaguayanPennsylvania GermanPeruvianPimaPolishPortuguesePotawatomiPuebloPuerto RicanPuget Sound SalishRomanianRussianSalvadoranSamoanScandinavianScotch-IrishScottishSeminoleSenegaleseSerbianShoshoneSierra LeoneanSiouxSlavicSlovakSloveneSomaliSouth AfricanSouth AmericanSouth American IndianSoviet UnionSpaniardSpanishSpanish AmericanSpanish American IndianSri LankanSubsaharan AfricanSudaneseSwedishSwissSyrianTaiwaneseThaiTlingit-HaidaTohono O'OdhamTonganTrinidadian and TobagonianTsimshianTurkishU.S. Virgin IslanderUgandanUkrainianUruguayanUteVenezuelanVietnameseWelshWest IndianYakamaYaquiYugoslavianYumanYup'ikZimbabwean
Immigration
NonimmigrantsImmigrantsAfghanistanAfricaAlbaniaArgentinaArmeniaAsiaAustraliaAustriaBahamasBangladeshBarbadosBelarusBelgiumBelizeBoliviaBosnia and HerzegovinaBrazilBulgariaBurma/MyanmarCabo VerdeCambodiaCameroonCanadaCaribbeanCentral AmericaChileChinaColombiaCongoCosta RicaCroatiaCubaCzechoslovakiaDenmarkDominicaDominican RepublicEastern AfricaEastern AsiaEastern EuropeEcuadorEgyptEl SalvadorEnglandEritreaEthiopiaEuropeFijiFranceGermanyGhanaGreeceGrenadaGuatemalaGuyanaHaitiHondurasHong KongHungaryIndiaIndonesiaIranIraqIsraelItalyJamaicaJapanJordanKazakhstanKenyaKoreaKuwaitLaosLatin AmericaLatviaLebanonLiberiaLithuaniaMalaysiaMexicoMicronesiaMiddle AfricaMoldovaMoroccoNepalNetherlandsNicaraguaNigeriaNorth AmericaNorth MacedoniaNorthern AfricaNorthern EuropeNorwayOceaniaPakistanPanamaPeruPhilippinesPolandPortugalRomaniaRussiaSaudi ArabiaScotlandSenegalSerbiaSierra LeoneSingaporeSomaliaSouth AfricaSouth AmericaSouth Central AsiaSouth Eastern AsiaSouthern EuropeSpainSri LankaSt. Vincent and the GrenadinesSudanSwedenSwitzerlandSyriaTaiwanThailandTrinidad and TobagoTurkeyUgandaUkraineUruguayUzbekistanVenezuelaVietnamWest IndiesWestern AfricaWestern AsiaWestern EuropeYemenZaireZimbabweAzores
Immigrants from Ireland
Race
Ancestry
AfghanAfricanAlaska NativeAlaskan AthabascanAlbanianAleutAlsatianAmericanApacheArabArapahoArgentineanArmenianAssyrian/Chaldean/SyriacAustralianAustrianBahamianBangladeshiBarbadianBasqueBelgianBelizeanBermudanBlackfeetBolivianBrazilianBritishBritish West IndianBulgarianBurmeseCajunCambodianCanadianCape VerdeanCarpatho RusynCelticCentral AmericanCentral American IndianCherokeeCheyenneChickasawChileanChineseChippewaChoctawColombianColvilleComancheCosta RicanCreeCreekCroatianCrowCubanCypriotCzechCzechoslovakianDanishDelawareDominicanDutchDutch West IndianEastern EuropeanEcuadorianEgyptianEnglishEstonianEthiopianEuropeanFijianFilipinoFinnishFrenchFrench American IndianFrench CanadianGermanGerman RussianGhanaianGreekGuamanian/ChamorroGuatemalanGuyaneseHaitianHmongHonduranHopiHoumaHungarianIcelanderIndian (Asian)IndonesianInupiatIranianIraqiIrishIroquoisIsraeliItalianJamaicanJapaneseJordanianKenyanKiowaKoreanLaotianLatvianLebaneseLiberianLithuanianLumbeeLuxembourgerMacedonianMalaysianMalteseMarshalleseMenomineeMexicanMexican American IndianMongolianMoroccanNative HawaiianNavajoNepaleseNew ZealanderNicaraguanNigerianNorthern EuropeanNorwegianOkinawanOsageOttawaPaiutePakistaniPalestinianPanamanianParaguayanPennsylvania GermanPeruvianPimaPolishPortuguesePotawatomiPuebloPuerto RicanPuget Sound SalishRomanianRussianSalvadoranSamoanScandinavianScotch-IrishScottishSeminoleSenegaleseSerbianShoshoneSierra LeoneanSiouxSlavicSlovakSloveneSomaliSouth AfricanSouth AmericanSouth American IndianSoviet UnionSpaniardSpanishSpanish AmericanSpanish American IndianSri LankanSubsaharan AfricanSudaneseSwedishSwissSyrianTaiwaneseThaiTlingit-HaidaTohono O'OdhamTonganTrinidadian and TobagonianTsimshianTurkishU.S. Virgin IslanderUgandanUkrainianUruguayanUteVenezuelanVietnameseWelshWest IndianYakamaYaquiYugoslavianYumanYup'ikZimbabwean
Immigration
NonimmigrantsImmigrantsAfghanistanAfricaAlbaniaArgentinaArmeniaAsiaAustraliaAustriaBahamasBangladeshBarbadosBelarusBelgiumBelizeBoliviaBosnia and HerzegovinaBrazilBulgariaBurma/MyanmarCabo VerdeCambodiaCameroonCanadaCaribbeanCentral AmericaChileChinaColombiaCongoCosta RicaCroatiaCubaCzechoslovakiaDenmarkDominicaDominican RepublicEastern AfricaEastern AsiaEastern EuropeEcuadorEgyptEl SalvadorEnglandEritreaEthiopiaEuropeFijiFranceGermanyGhanaGreeceGrenadaGuatemalaGuyanaHaitiHondurasHong KongHungaryIndiaIndonesiaIranIraqIrelandIsraelItalyJamaicaJapanJordanKazakhstanKenyaKoreaKuwaitLaosLatin AmericaLatviaLebanonLiberiaLithuaniaMalaysiaMexicoMicronesiaMiddle AfricaMoldovaMoroccoNepalNetherlandsNicaraguaNigeriaNorth AmericaNorth MacedoniaNorthern AfricaNorthern EuropeNorwayOceaniaPakistanPanamaPeruPhilippinesPolandPortugalRomaniaRussiaSaudi ArabiaScotlandSenegalSerbiaSierra LeoneSingaporeSomaliaSouth AfricaSouth AmericaSouth Central AsiaSouth Eastern AsiaSouthern EuropeSpainSri LankaSt. Vincent and the GrenadinesSudanSwedenSwitzerlandSyriaTaiwanThailandTrinidad and TobagoTurkeyUgandaUkraineUruguayUzbekistanVenezuelaVietnamWest IndiesWestern AfricaWestern AsiaWestern EuropeYemenZaireZimbabweAzores
Median Family Income
Income
Poverty
Unemployment
Labor Participation
Family Structure
Vehicle Availability
Education Level
Disability

Median Family Income Comparison

Bhutanese

Immigrants from Ireland

Exceptional
Exceptional
$119,800
MEDIAN FAMILY INCOME
100.0/ 100
METRIC RATING
33rd/ 347
METRIC RANK
$127,584
MEDIAN FAMILY INCOME
100.0/ 100
METRIC RATING
10th/ 347
METRIC RANK

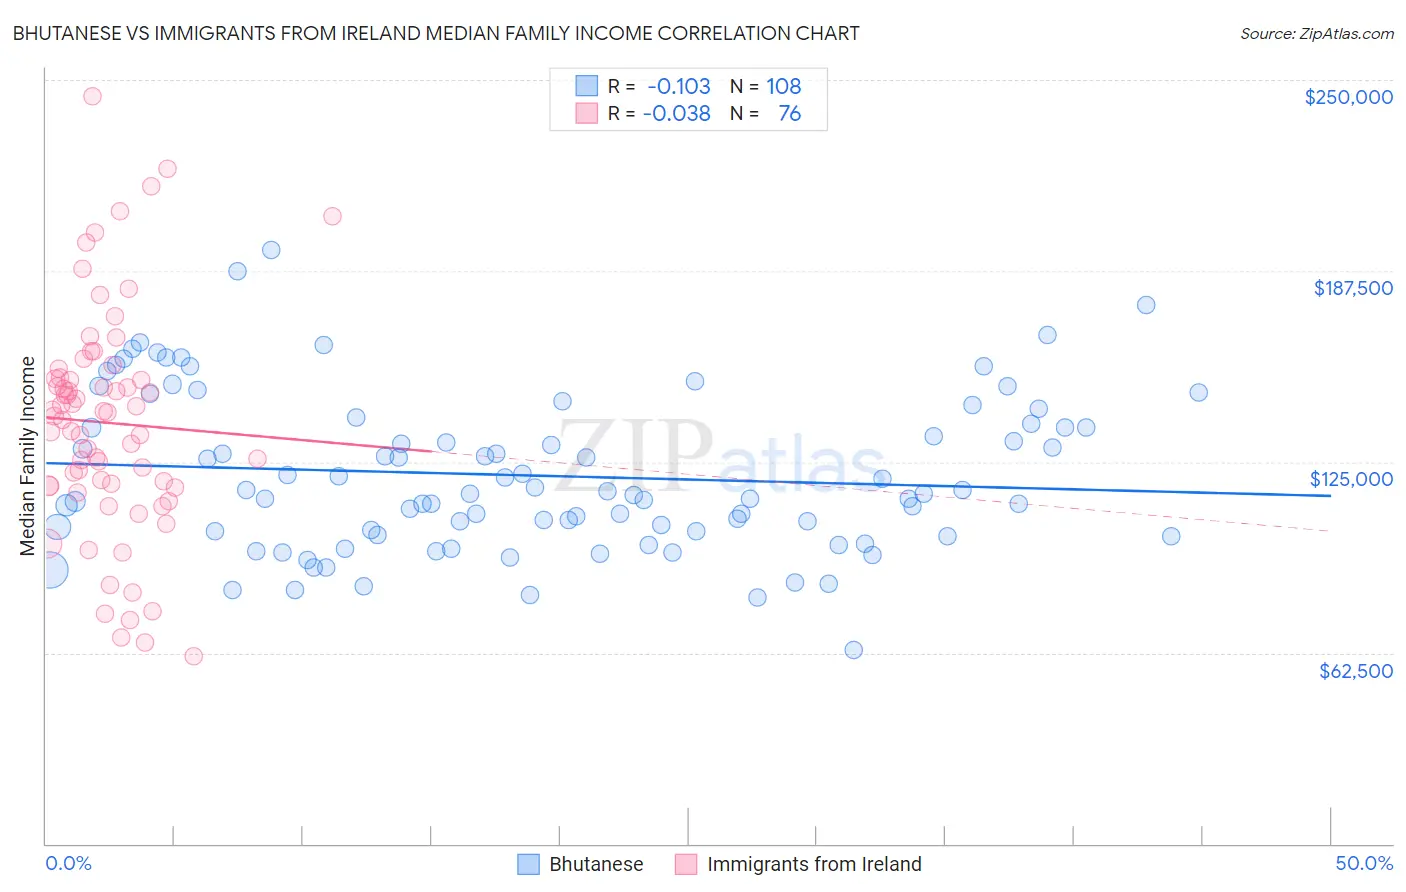
Bhutanese vs Immigrants from Ireland Median Family Income Correlation Chart

The statistical analysis conducted on geographies consisting of 454,953,353 people shows a poor negative correlation between the proportion of Bhutanese and median family income in the United States with a correlation coefficient (R) of -0.103 and weighted average of $119,800. Similarly, the statistical analysis conducted on geographies consisting of 240,734,590 people shows no correlation between the proportion of Immigrants from Ireland and median family income in the United States with a correlation coefficient (R) of -0.038 and weighted average of $127,584, a difference of 6.5%.
Bhutanese vs Immigrants from Ireland Median Family Income

Median Family Income Correlation Summary

MeasurementBhutaneseImmigrants from Ireland
Minimum$63,382$61,250
Maximum$194,165$244,785
Range$130,783$183,535
Mean$120,532$137,790
Median$114,614$140,594
Interquartile 25% (IQ1)$101,662$117,130
Interquartile 75% (IQ3)$136,845$152,367
Interquartile Range (IQR)$35,183$35,237
Standard Deviation (Sample)$25,704$36,818
Standard Deviation (Population)$25,585$36,575

Similar Demographics by Median Family Income

Demographics Similar to Bhutanese by Median Family Income

In terms of median family income, the demographic groups most similar to Bhutanese are Asian ($119,955, a difference of 0.13%), Immigrants from France ($120,076, a difference of 0.23%), Bolivian ($119,479, a difference of 0.27%), Immigrants from Sri Lanka ($120,263, a difference of 0.39%), and Latvian ($120,301, a difference of 0.42%).
DemographicsRating | RankMedian Family Income
Immigrants | Switzerland
100.0
/100
|
#26
Exceptional
$120,726
Russians
100.0
/100
|
#27
Exceptional
$120,487
Immigrants | Denmark
100.0
/100
|
#28
Exceptional
$120,445
Latvians
100.0
/100
|
#29
Exceptional
$120,301
Immigrants | Sri Lanka
100.0
/100
|
#30
Exceptional
$120,263
Immigrants | France
100.0
/100
|
#31
Exceptional
$120,076
Asians
100.0
/100
|
#32
Exceptional
$119,955
Bhutanese
100.0
/100
|
#33
Exceptional
$119,800
Bolivians
100.0
/100
|
#34
Exceptional
$119,479
Soviet Union
100.0
/100
|
#35
Exceptional
$119,262
Israelis
100.0
/100
|
#36
Exceptional
$118,577
Australians
100.0
/100
|
#37
Exceptional
$118,440
Immigrants | Turkey
100.0
/100
|
#38
Exceptional
$118,325
Immigrants | Asia
100.0
/100
|
#39
Exceptional
$118,291
Immigrants | Lithuania
100.0
/100
|
#40
Exceptional
$118,053

Demographics Similar to Immigrants from Ireland by Median Family Income

In terms of median family income, the demographic groups most similar to Immigrants from Ireland are Immigrants from Israel ($127,430, a difference of 0.12%), Cypriot ($127,064, a difference of 0.41%), Immigrants from Australia ($126,620, a difference of 0.76%), Immigrants from South Central Asia ($125,956, a difference of 1.3%), and Eastern European ($125,546, a difference of 1.6%).
DemographicsRating | RankMedian Family Income
Immigrants | Singapore
100.0
/100
|
#3
Exceptional
$134,818
Immigrants | India
100.0
/100
|
#4
Exceptional
$134,028
Iranians
100.0
/100
|
#5
Exceptional
$133,839
Thais
100.0
/100
|
#6
Exceptional
$131,281
Immigrants | Hong Kong
100.0
/100
|
#7
Exceptional
$131,067
Immigrants | Iran
100.0
/100
|
#8
Exceptional
$130,894
Okinawans
100.0
/100
|
#9
Exceptional
$129,979
Immigrants | Ireland
100.0
/100
|
#10
Exceptional
$127,584
Immigrants | Israel
100.0
/100
|
#11
Exceptional
$127,430
Cypriots
100.0
/100
|
#12
Exceptional
$127,064
Immigrants | Australia
100.0
/100
|
#13
Exceptional
$126,620
Immigrants | South Central Asia
100.0
/100
|
#14
Exceptional
$125,956
Eastern Europeans
100.0
/100
|
#15
Exceptional
$125,546
Immigrants | China
100.0
/100
|
#16
Exceptional
$125,540
Indians (Asian)
100.0
/100
|
#17
Exceptional
$125,312