Bhutanese vs Immigrants from Croatia Median Family Income

COMPARE

Bhutanese
Race
Ancestry
AfghanAfricanAlaska NativeAlaskan AthabascanAlbanianAleutAlsatianAmericanApacheArabArapahoArgentineanArmenianAssyrian/Chaldean/SyriacAustralianAustrianBahamianBangladeshiBarbadianBasqueBelgianBelizeanBermudanBhutaneseBlackfeetBolivianBrazilianBritishBritish West IndianBulgarianBurmeseCajunCambodianCanadianCape VerdeanCarpatho RusynCelticCentral AmericanCentral American IndianCherokeeCheyenneChickasawChileanChineseChippewaChoctawColombianColvilleComancheCosta RicanCreeCreekCroatianCrowCubanCypriotCzechCzechoslovakianDanishDelawareDominicanDutchDutch West IndianEastern EuropeanEcuadorianEgyptianEnglishEstonianEthiopianEuropeanFijianFilipinoFinnishFrenchFrench American IndianFrench CanadianGermanGerman RussianGhanaianGreekGuamanian/ChamorroGuatemalanGuyaneseHaitianHmongHonduranHopiHoumaHungarianIcelanderIndian (Asian)IndonesianInupiatIranianIraqiIrishIroquoisIsraeliItalianJamaicanJapaneseJordanianKenyanKiowaKoreanLaotianLatvianLebaneseLiberianLithuanianLumbeeLuxembourgerMacedonianMalaysianMalteseMarshalleseMenomineeMexicanMexican American IndianMongolianMoroccanNative HawaiianNavajoNepaleseNew ZealanderNicaraguanNigerianNorthern EuropeanNorwegianOkinawanOsageOttawaPaiutePakistaniPalestinianPanamanianParaguayanPennsylvania GermanPeruvianPimaPolishPortuguesePotawatomiPuebloPuerto RicanPuget Sound SalishRomanianRussianSalvadoranSamoanScandinavianScotch-IrishScottishSeminoleSenegaleseSerbianShoshoneSierra LeoneanSiouxSlavicSlovakSloveneSomaliSouth AfricanSouth AmericanSouth American IndianSoviet UnionSpaniardSpanishSpanish AmericanSpanish American IndianSri LankanSubsaharan AfricanSudaneseSwedishSwissSyrianTaiwaneseThaiTlingit-HaidaTohono O'OdhamTonganTrinidadian and TobagonianTsimshianTurkishU.S. Virgin IslanderUgandanUkrainianUruguayanUteVenezuelanVietnameseWelshWest IndianYakamaYaquiYugoslavianYumanYup'ikZimbabwean
Immigration
NonimmigrantsImmigrantsAfghanistanAfricaAlbaniaArgentinaArmeniaAsiaAustraliaAustriaBahamasBangladeshBarbadosBelarusBelgiumBelizeBoliviaBosnia and HerzegovinaBrazilBulgariaBurma/MyanmarCabo VerdeCambodiaCameroonCanadaCaribbeanCentral AmericaChileChinaColombiaCongoCosta RicaCubaCzechoslovakiaDenmarkDominicaDominican RepublicEastern AfricaEastern AsiaEastern EuropeEcuadorEgyptEl SalvadorEnglandEritreaEthiopiaEuropeFijiFranceGermanyGhanaGreeceGrenadaGuatemalaGuyanaHaitiHondurasHong KongHungaryIndiaIndonesiaIranIraqIrelandIsraelItalyJamaicaJapanJordanKazakhstanKenyaKoreaKuwaitLaosLatin AmericaLatviaLebanonLiberiaLithuaniaMalaysiaMexicoMicronesiaMiddle AfricaMoldovaMoroccoNepalNetherlandsNicaraguaNigeriaNorth AmericaNorth MacedoniaNorthern AfricaNorthern EuropeNorwayOceaniaPakistanPanamaPeruPhilippinesPolandPortugalRomaniaRussiaSaudi ArabiaScotlandSenegalSerbiaSierra LeoneSingaporeSomaliaSouth AfricaSouth AmericaSouth Central AsiaSouth Eastern AsiaSouthern EuropeSpainSri LankaSt. Vincent and the GrenadinesSudanSwedenSwitzerlandSyriaTaiwanThailandTrinidad and TobagoTurkeyUgandaUkraineUruguayUzbekistanVenezuelaVietnamWest IndiesWestern AfricaWestern AsiaWestern EuropeYemenZaireZimbabweAzores
Immigrants from Croatia
Race
Ancestry
AfghanAfricanAlaska NativeAlaskan AthabascanAlbanianAleutAlsatianAmericanApacheArabArapahoArgentineanArmenianAssyrian/Chaldean/SyriacAustralianAustrianBahamianBangladeshiBarbadianBasqueBelgianBelizeanBermudanBlackfeetBolivianBrazilianBritishBritish West IndianBulgarianBurmeseCajunCambodianCanadianCape VerdeanCarpatho RusynCelticCentral AmericanCentral American IndianCherokeeCheyenneChickasawChileanChineseChippewaChoctawColombianColvilleComancheCosta RicanCreeCreekCroatianCrowCubanCypriotCzechCzechoslovakianDanishDelawareDominicanDutchDutch West IndianEastern EuropeanEcuadorianEgyptianEnglishEstonianEthiopianEuropeanFijianFilipinoFinnishFrenchFrench American IndianFrench CanadianGermanGerman RussianGhanaianGreekGuamanian/ChamorroGuatemalanGuyaneseHaitianHmongHonduranHopiHoumaHungarianIcelanderIndian (Asian)IndonesianInupiatIranianIraqiIrishIroquoisIsraeliItalianJamaicanJapaneseJordanianKenyanKiowaKoreanLaotianLatvianLebaneseLiberianLithuanianLumbeeLuxembourgerMacedonianMalaysianMalteseMarshalleseMenomineeMexicanMexican American IndianMongolianMoroccanNative HawaiianNavajoNepaleseNew ZealanderNicaraguanNigerianNorthern EuropeanNorwegianOkinawanOsageOttawaPaiutePakistaniPalestinianPanamanianParaguayanPennsylvania GermanPeruvianPimaPolishPortuguesePotawatomiPuebloPuerto RicanPuget Sound SalishRomanianRussianSalvadoranSamoanScandinavianScotch-IrishScottishSeminoleSenegaleseSerbianShoshoneSierra LeoneanSiouxSlavicSlovakSloveneSomaliSouth AfricanSouth AmericanSouth American IndianSoviet UnionSpaniardSpanishSpanish AmericanSpanish American IndianSri LankanSubsaharan AfricanSudaneseSwedishSwissSyrianTaiwaneseThaiTlingit-HaidaTohono O'OdhamTonganTrinidadian and TobagonianTsimshianTurkishU.S. Virgin IslanderUgandanUkrainianUruguayanUteVenezuelanVietnameseWelshWest IndianYakamaYaquiYugoslavianYumanYup'ikZimbabwean
Immigration
NonimmigrantsImmigrantsAfghanistanAfricaAlbaniaArgentinaArmeniaAsiaAustraliaAustriaBahamasBangladeshBarbadosBelarusBelgiumBelizeBoliviaBosnia and HerzegovinaBrazilBulgariaBurma/MyanmarCabo VerdeCambodiaCameroonCanadaCaribbeanCentral AmericaChileChinaColombiaCongoCosta RicaCroatiaCubaCzechoslovakiaDenmarkDominicaDominican RepublicEastern AfricaEastern AsiaEastern EuropeEcuadorEgyptEl SalvadorEnglandEritreaEthiopiaEuropeFijiFranceGermanyGhanaGreeceGrenadaGuatemalaGuyanaHaitiHondurasHong KongHungaryIndiaIndonesiaIranIraqIrelandIsraelItalyJamaicaJapanJordanKazakhstanKenyaKoreaKuwaitLaosLatin AmericaLatviaLebanonLiberiaLithuaniaMalaysiaMexicoMicronesiaMiddle AfricaMoldovaMoroccoNepalNetherlandsNicaraguaNigeriaNorth AmericaNorth MacedoniaNorthern AfricaNorthern EuropeNorwayOceaniaPakistanPanamaPeruPhilippinesPolandPortugalRomaniaRussiaSaudi ArabiaScotlandSenegalSerbiaSierra LeoneSingaporeSomaliaSouth AfricaSouth AmericaSouth Central AsiaSouth Eastern AsiaSouthern EuropeSpainSri LankaSt. Vincent and the GrenadinesSudanSwedenSwitzerlandSyriaTaiwanThailandTrinidad and TobagoTurkeyUgandaUkraineUruguayUzbekistanVenezuelaVietnamWest IndiesWestern AfricaWestern AsiaWestern EuropeYemenZaireZimbabweAzores
Median Family Income
Income
Poverty
Unemployment
Labor Participation
Family Structure
Vehicle Availability
Education Level
Disability

Median Family Income Comparison

Bhutanese

Immigrants from Croatia

Exceptional
Exceptional
$119,800
MEDIAN FAMILY INCOME
100.0/ 100
METRIC RATING
33rd/ 347
METRIC RANK
$112,323
MEDIAN FAMILY INCOME
99.3/ 100
METRIC RATING
80th/ 347
METRIC RANK

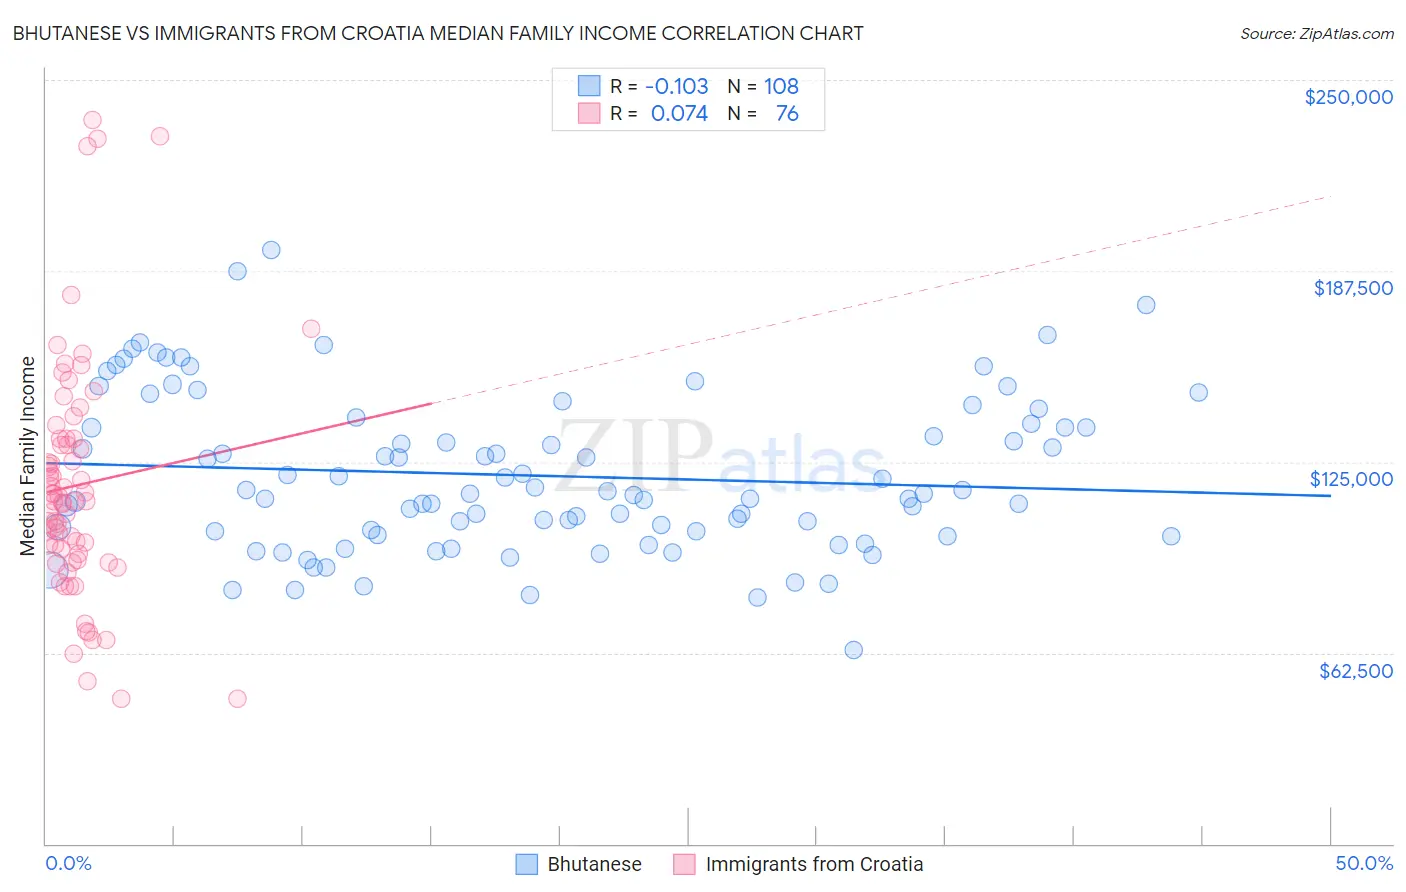
Bhutanese vs Immigrants from Croatia Median Family Income Correlation Chart

The statistical analysis conducted on geographies consisting of 454,953,353 people shows a poor negative correlation between the proportion of Bhutanese and median family income in the United States with a correlation coefficient (R) of -0.103 and weighted average of $119,800. Similarly, the statistical analysis conducted on geographies consisting of 132,566,402 people shows a slight positive correlation between the proportion of Immigrants from Croatia and median family income in the United States with a correlation coefficient (R) of 0.074 and weighted average of $112,323, a difference of 6.7%.
Bhutanese vs Immigrants from Croatia Median Family Income

Median Family Income Correlation Summary

MeasurementBhutaneseImmigrants from Croatia
Minimum$63,382$47,321
Maximum$194,165$236,888
Range$130,783$189,567
Mean$120,532$117,325
Median$114,614$112,019
Interquartile 25% (IQ1)$101,662$93,889
Interquartile 75% (IQ3)$136,845$132,485
Interquartile Range (IQR)$35,183$38,596
Standard Deviation (Sample)$25,704$39,118
Standard Deviation (Population)$25,585$38,860

Similar Demographics by Median Family Income

Demographics Similar to Bhutanese by Median Family Income

In terms of median family income, the demographic groups most similar to Bhutanese are Asian ($119,955, a difference of 0.13%), Immigrants from France ($120,076, a difference of 0.23%), Bolivian ($119,479, a difference of 0.27%), Immigrants from Sri Lanka ($120,263, a difference of 0.39%), and Latvian ($120,301, a difference of 0.42%).
DemographicsRating | RankMedian Family Income
Immigrants | Switzerland
100.0
/100
|
#26
Exceptional
$120,726
Russians
100.0
/100
|
#27
Exceptional
$120,487
Immigrants | Denmark
100.0
/100
|
#28
Exceptional
$120,445
Latvians
100.0
/100
|
#29
Exceptional
$120,301
Immigrants | Sri Lanka
100.0
/100
|
#30
Exceptional
$120,263
Immigrants | France
100.0
/100
|
#31
Exceptional
$120,076
Asians
100.0
/100
|
#32
Exceptional
$119,955
Bhutanese
100.0
/100
|
#33
Exceptional
$119,800
Bolivians
100.0
/100
|
#34
Exceptional
$119,479
Soviet Union
100.0
/100
|
#35
Exceptional
$119,262
Israelis
100.0
/100
|
#36
Exceptional
$118,577
Australians
100.0
/100
|
#37
Exceptional
$118,440
Immigrants | Turkey
100.0
/100
|
#38
Exceptional
$118,325
Immigrants | Asia
100.0
/100
|
#39
Exceptional
$118,291
Immigrants | Lithuania
100.0
/100
|
#40
Exceptional
$118,053

Demographics Similar to Immigrants from Croatia by Median Family Income

In terms of median family income, the demographic groups most similar to Immigrants from Croatia are Italian ($112,372, a difference of 0.040%), Immigrants from Canada ($112,374, a difference of 0.050%), Immigrants from North America ($112,151, a difference of 0.15%), Immigrants from Eastern Europe ($112,527, a difference of 0.18%), and Immigrants from England ($112,038, a difference of 0.25%).
DemographicsRating | RankMedian Family Income
Laotians
99.5
/100
|
#73
Exceptional
$112,859
Immigrants | Italy
99.4
/100
|
#74
Exceptional
$112,848
Immigrants | Western Europe
99.4
/100
|
#75
Exceptional
$112,688
Argentineans
99.4
/100
|
#76
Exceptional
$112,665
Immigrants | Eastern Europe
99.4
/100
|
#77
Exceptional
$112,527
Immigrants | Canada
99.3
/100
|
#78
Exceptional
$112,374
Italians
99.3
/100
|
#79
Exceptional
$112,372
Immigrants | Croatia
99.3
/100
|
#80
Exceptional
$112,323
Immigrants | North America
99.2
/100
|
#81
Exceptional
$112,151
Immigrants | England
99.2
/100
|
#82
Exceptional
$112,038
Immigrants | Egypt
99.0
/100
|
#83
Exceptional
$111,689
Immigrants | Hungary
98.8
/100
|
#84
Exceptional
$111,378
Croatians
98.8
/100
|
#85
Exceptional
$111,370
Ukrainians
98.8
/100
|
#86
Exceptional
$111,368
Austrians
98.8
/100
|
#87
Exceptional
$111,306