Bhutanese vs Bolivian Median Family Income
COMPARE
Bhutanese
Bolivian
Median Family Income
Median Family Income Comparison
Bhutanese
Bolivians
$119,800
MEDIAN FAMILY INCOME
100.0/ 100
METRIC RATING
33rd/ 347
METRIC RANK
$119,479
MEDIAN FAMILY INCOME
100.0/ 100
METRIC RATING
34th/ 347
METRIC RANK
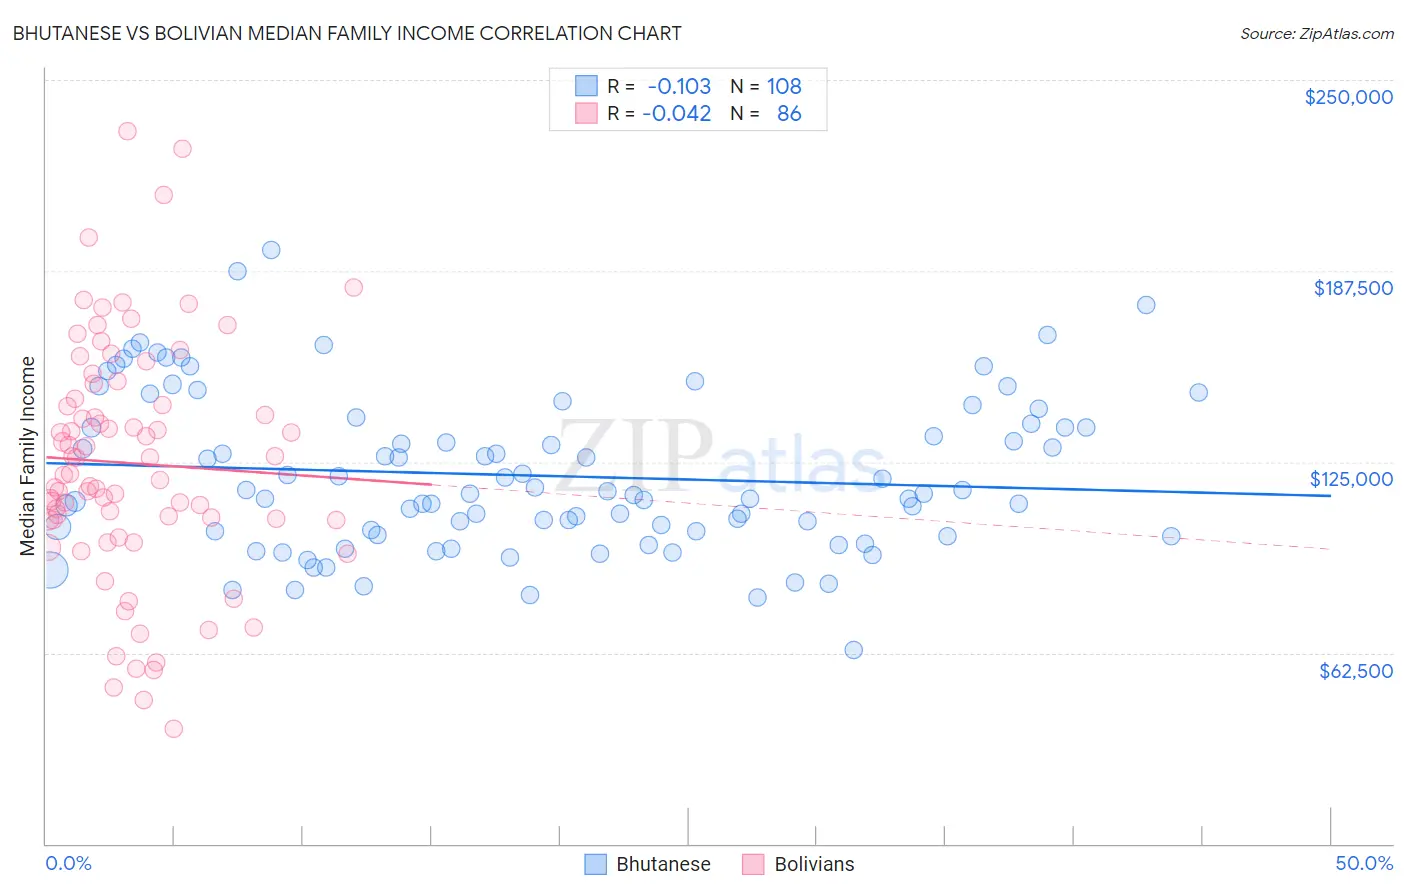
Bhutanese vs Bolivian Median Family Income Correlation Chart
The statistical analysis conducted on geographies consisting of 454,953,353 people shows a poor negative correlation between the proportion of Bhutanese and median family income in the United States with a correlation coefficient (R) of -0.103 and weighted average of $119,800. Similarly, the statistical analysis conducted on geographies consisting of 184,605,478 people shows no correlation between the proportion of Bolivians and median family income in the United States with a correlation coefficient (R) of -0.042 and weighted average of $119,479, a difference of 0.27%.
Median Family Income Correlation Summary
| Measurement | Bhutanese | Bolivian |
| Minimum | $63,382 | $37,679 |
| Maximum | $194,165 | $233,276 |
| Range | $130,783 | $195,597 |
| Mean | $120,532 | $124,569 |
| Median | $114,614 | $120,978 |
| Interquartile 25% (IQ1) | $101,662 | $106,050 |
| Interquartile 75% (IQ3) | $136,845 | $145,603 |
| Interquartile Range (IQR) | $35,183 | $39,553 |
| Standard Deviation (Sample) | $25,704 | $39,306 |
| Standard Deviation (Population) | $25,585 | $39,077 |
Demographics Similar to Bhutanese and Bolivians by Median Family Income
In terms of median family income, the demographic groups most similar to Bhutanese are Asian ($119,955, a difference of 0.13%), Immigrants from France ($120,076, a difference of 0.23%), Immigrants from Sri Lanka ($120,263, a difference of 0.39%), Latvian ($120,301, a difference of 0.42%), and Soviet Union ($119,262, a difference of 0.45%). Similarly, the demographic groups most similar to Bolivians are Soviet Union ($119,262, a difference of 0.18%), Asian ($119,955, a difference of 0.40%), Immigrants from France ($120,076, a difference of 0.50%), Immigrants from Sri Lanka ($120,263, a difference of 0.66%), and Latvian ($120,301, a difference of 0.69%).
| Demographics | Rating | Rank | Median Family Income |
| Immigrants | Japan | 100.0 /100 | #23 | Exceptional $122,764 |
| Immigrants | Northern Europe | 100.0 /100 | #24 | Exceptional $121,840 |
| Turks | 100.0 /100 | #25 | Exceptional $121,202 |
| Immigrants | Switzerland | 100.0 /100 | #26 | Exceptional $120,726 |
| Russians | 100.0 /100 | #27 | Exceptional $120,487 |
| Immigrants | Denmark | 100.0 /100 | #28 | Exceptional $120,445 |
| Latvians | 100.0 /100 | #29 | Exceptional $120,301 |
| Immigrants | Sri Lanka | 100.0 /100 | #30 | Exceptional $120,263 |
| Immigrants | France | 100.0 /100 | #31 | Exceptional $120,076 |
| Asians | 100.0 /100 | #32 | Exceptional $119,955 |
| Bhutanese | 100.0 /100 | #33 | Exceptional $119,800 |
| Bolivians | 100.0 /100 | #34 | Exceptional $119,479 |
| Soviet Union | 100.0 /100 | #35 | Exceptional $119,262 |
| Israelis | 100.0 /100 | #36 | Exceptional $118,577 |
| Australians | 100.0 /100 | #37 | Exceptional $118,440 |
| Immigrants | Turkey | 100.0 /100 | #38 | Exceptional $118,325 |
| Immigrants | Asia | 100.0 /100 | #39 | Exceptional $118,291 |
| Immigrants | Lithuania | 100.0 /100 | #40 | Exceptional $118,053 |
| Estonians | 100.0 /100 | #41 | Exceptional $118,013 |
| Immigrants | Bolivia | 100.0 /100 | #42 | Exceptional $117,912 |
| Bulgarians | 100.0 /100 | #43 | Exceptional $117,818 |