Bhutanese vs Colombian Median Family Income
COMPARE
Bhutanese
Colombian
Median Family Income
Median Family Income Comparison
Bhutanese
Colombians
$119,800
MEDIAN FAMILY INCOME
100.0/ 100
METRIC RATING
33rd/ 347
METRIC RANK
$100,750
MEDIAN FAMILY INCOME
27.2/ 100
METRIC RATING
191st/ 347
METRIC RANK
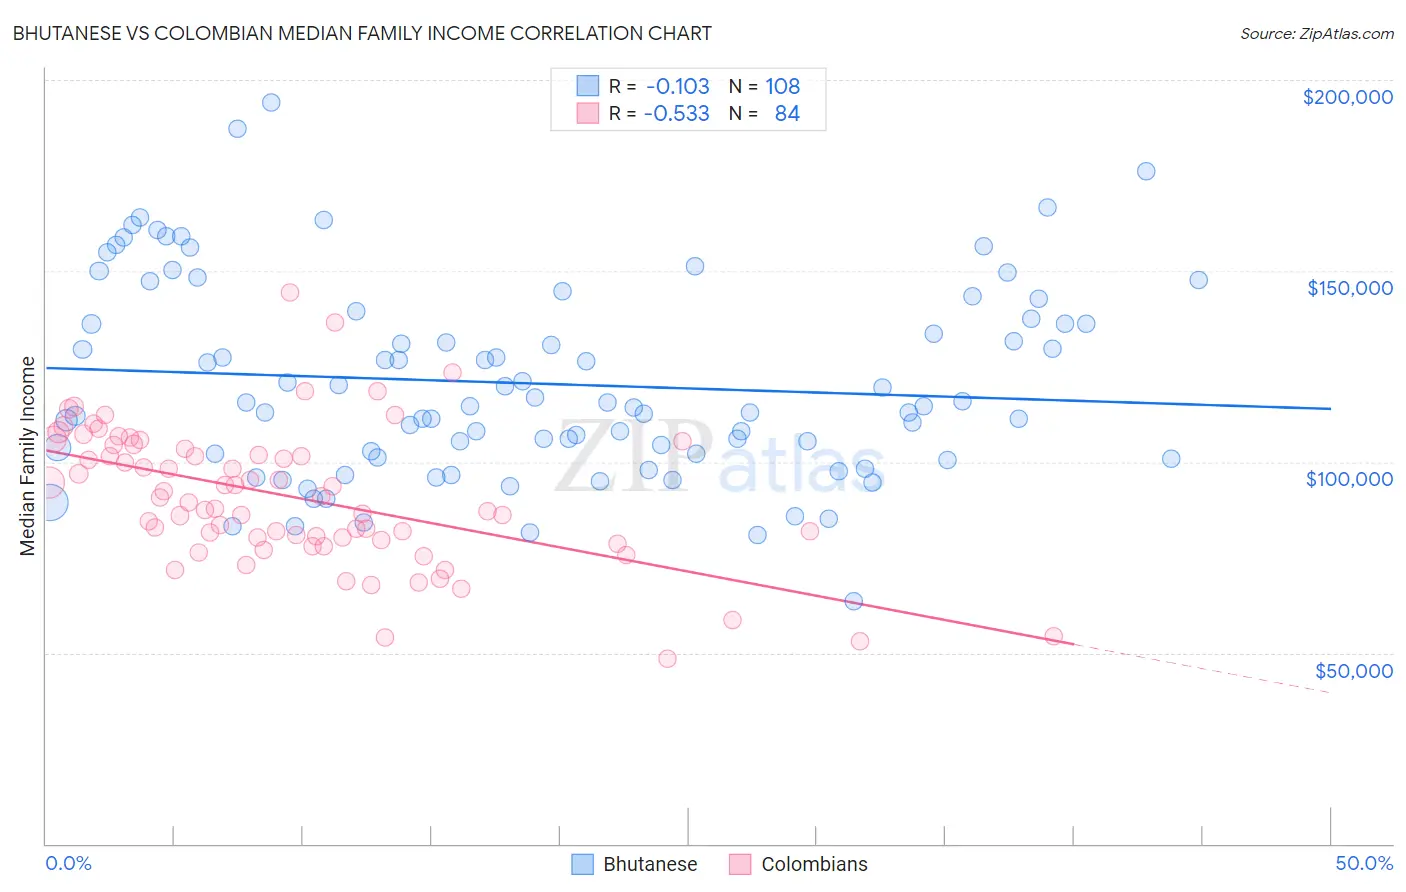
Bhutanese vs Colombian Median Family Income Correlation Chart
The statistical analysis conducted on geographies consisting of 454,953,353 people shows a poor negative correlation between the proportion of Bhutanese and median family income in the United States with a correlation coefficient (R) of -0.103 and weighted average of $119,800. Similarly, the statistical analysis conducted on geographies consisting of 419,162,834 people shows a substantial negative correlation between the proportion of Colombians and median family income in the United States with a correlation coefficient (R) of -0.533 and weighted average of $100,750, a difference of 18.9%.
Median Family Income Correlation Summary
| Measurement | Bhutanese | Colombian |
| Minimum | $63,382 | $48,304 |
| Maximum | $194,165 | $144,224 |
| Range | $130,783 | $95,920 |
| Mean | $120,532 | $90,772 |
| Median | $114,614 | $90,051 |
| Interquartile 25% (IQ1) | $101,662 | $79,908 |
| Interquartile 75% (IQ3) | $136,845 | $103,968 |
| Interquartile Range (IQR) | $35,183 | $24,060 |
| Standard Deviation (Sample) | $25,704 | $18,065 |
| Standard Deviation (Population) | $25,585 | $17,957 |
Similar Demographics by Median Family Income
Demographics Similar to Bhutanese by Median Family Income
In terms of median family income, the demographic groups most similar to Bhutanese are Asian ($119,955, a difference of 0.13%), Immigrants from France ($120,076, a difference of 0.23%), Bolivian ($119,479, a difference of 0.27%), Immigrants from Sri Lanka ($120,263, a difference of 0.39%), and Latvian ($120,301, a difference of 0.42%).
| Demographics | Rating | Rank | Median Family Income |
| Immigrants | Switzerland | 100.0 /100 | #26 | Exceptional $120,726 |
| Russians | 100.0 /100 | #27 | Exceptional $120,487 |
| Immigrants | Denmark | 100.0 /100 | #28 | Exceptional $120,445 |
| Latvians | 100.0 /100 | #29 | Exceptional $120,301 |
| Immigrants | Sri Lanka | 100.0 /100 | #30 | Exceptional $120,263 |
| Immigrants | France | 100.0 /100 | #31 | Exceptional $120,076 |
| Asians | 100.0 /100 | #32 | Exceptional $119,955 |
| Bhutanese | 100.0 /100 | #33 | Exceptional $119,800 |
| Bolivians | 100.0 /100 | #34 | Exceptional $119,479 |
| Soviet Union | 100.0 /100 | #35 | Exceptional $119,262 |
| Israelis | 100.0 /100 | #36 | Exceptional $118,577 |
| Australians | 100.0 /100 | #37 | Exceptional $118,440 |
| Immigrants | Turkey | 100.0 /100 | #38 | Exceptional $118,325 |
| Immigrants | Asia | 100.0 /100 | #39 | Exceptional $118,291 |
| Immigrants | Lithuania | 100.0 /100 | #40 | Exceptional $118,053 |
Demographics Similar to Colombians by Median Family Income
In terms of median family income, the demographic groups most similar to Colombians are Immigrants from Kenya ($100,679, a difference of 0.070%), Iraqi ($100,658, a difference of 0.090%), Uruguayan ($100,656, a difference of 0.090%), Immigrants ($100,962, a difference of 0.21%), and Immigrants from Portugal ($100,984, a difference of 0.23%).
| Demographics | Rating | Rank | Median Family Income |
| Immigrants | Costa Rica | 33.7 /100 | #184 | Fair $101,354 |
| Dutch | 31.9 /100 | #185 | Fair $101,192 |
| Celtics | 31.3 /100 | #186 | Fair $101,139 |
| Tlingit-Haida | 30.8 /100 | #187 | Fair $101,092 |
| Guamanians/Chamorros | 30.5 /100 | #188 | Fair $101,061 |
| Immigrants | Portugal | 29.6 /100 | #189 | Fair $100,984 |
| Immigrants | Immigrants | 29.4 /100 | #190 | Fair $100,962 |
| Colombians | 27.2 /100 | #191 | Fair $100,750 |
| Immigrants | Kenya | 26.5 /100 | #192 | Fair $100,679 |
| Iraqis | 26.3 /100 | #193 | Fair $100,658 |
| Uruguayans | 26.3 /100 | #194 | Fair $100,656 |
| Immigrants | South America | 23.9 /100 | #195 | Fair $100,414 |
| Samoans | 23.3 /100 | #196 | Fair $100,344 |
| Immigrants | Cameroon | 22.8 /100 | #197 | Fair $100,289 |
| Immigrants | Africa | 22.5 /100 | #198 | Fair $100,256 |