Immigrants from Portugal vs Kenyan Median Family Income
COMPARE
Immigrants from Portugal
Kenyan
Median Family Income
Median Family Income Comparison
Immigrants from Portugal
Kenyans
$100,984
MEDIAN FAMILY INCOME
29.6/ 100
METRIC RATING
189th/ 347
METRIC RANK
$101,417
MEDIAN FAMILY INCOME
34.5/ 100
METRIC RATING
183rd/ 347
METRIC RANK
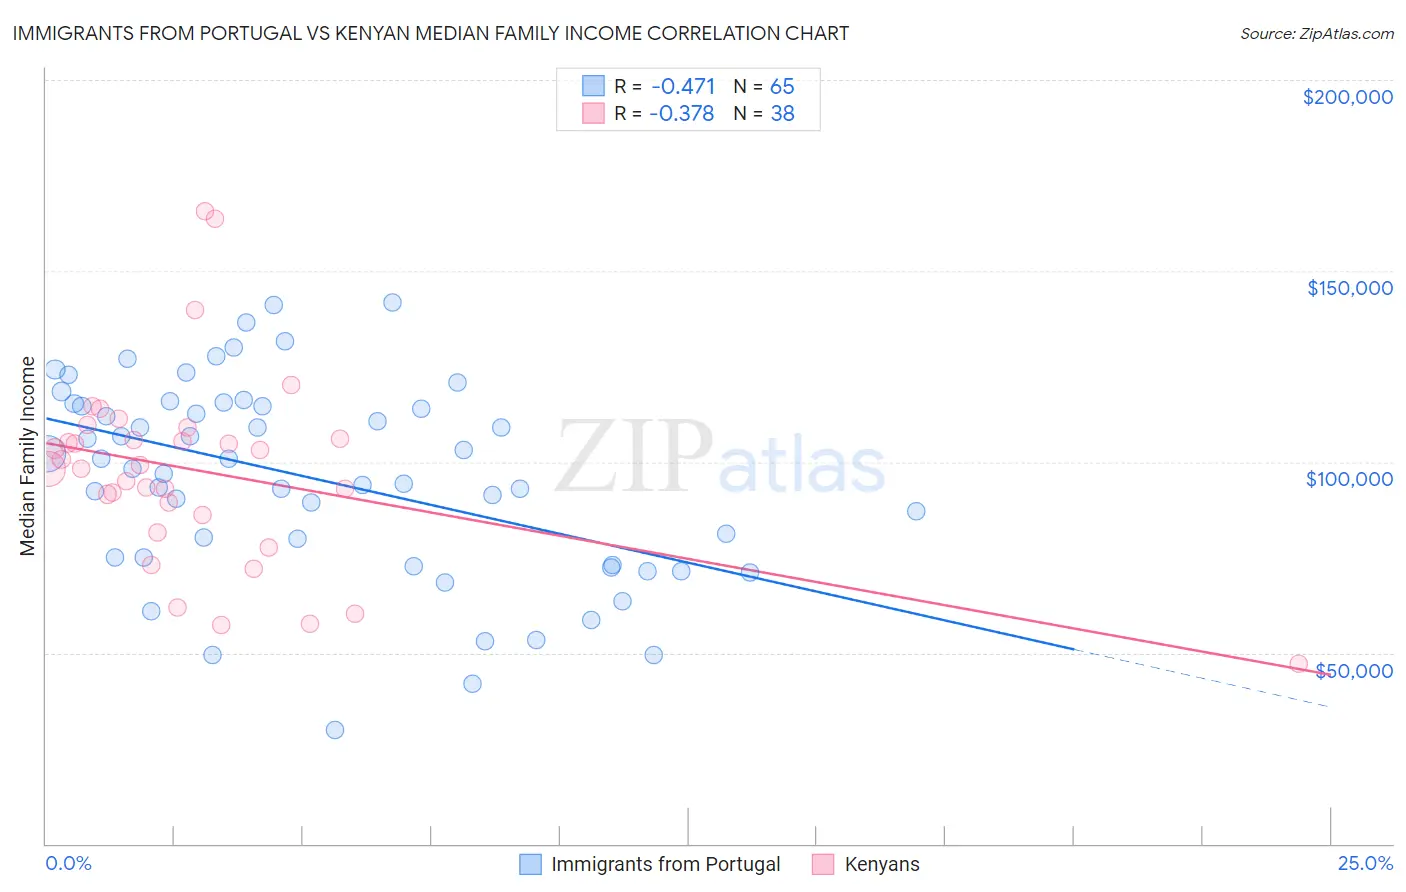
Immigrants from Portugal vs Kenyan Median Family Income Correlation Chart
The statistical analysis conducted on geographies consisting of 174,753,640 people shows a moderate negative correlation between the proportion of Immigrants from Portugal and median family income in the United States with a correlation coefficient (R) of -0.471 and weighted average of $100,984. Similarly, the statistical analysis conducted on geographies consisting of 168,122,613 people shows a mild negative correlation between the proportion of Kenyans and median family income in the United States with a correlation coefficient (R) of -0.378 and weighted average of $101,417, a difference of 0.43%.
Median Family Income Correlation Summary
| Measurement | Immigrants from Portugal | Kenyan |
| Minimum | $29,911 | $47,000 |
| Maximum | $141,703 | $165,640 |
| Range | $111,792 | $118,640 |
| Mean | $95,434 | $97,471 |
| Median | $98,112 | $98,633 |
| Interquartile 25% (IQ1) | $73,840 | $86,023 |
| Interquartile 75% (IQ3) | $114,950 | $106,111 |
| Interquartile Range (IQR) | $41,110 | $20,088 |
| Standard Deviation (Sample) | $25,863 | $25,158 |
| Standard Deviation (Population) | $25,663 | $24,824 |
Demographics Similar to Immigrants from Portugal and Kenyans by Median Family Income
In terms of median family income, the demographic groups most similar to Immigrants from Portugal are Immigrants ($100,962, a difference of 0.020%), Guamanian/Chamorro ($101,061, a difference of 0.080%), Tlingit-Haida ($101,092, a difference of 0.11%), Celtic ($101,139, a difference of 0.15%), and Dutch ($101,192, a difference of 0.21%). Similarly, the demographic groups most similar to Kenyans are Immigrants from Costa Rica ($101,354, a difference of 0.060%), Tsimshian ($101,543, a difference of 0.12%), Spaniard ($101,617, a difference of 0.20%), French Canadian ($101,634, a difference of 0.21%), and Dutch ($101,192, a difference of 0.22%).
| Demographics | Rating | Rank | Median Family Income |
| French | 46.1 /100 | #176 | Average $102,368 |
| Germans | 44.6 /100 | #177 | Average $102,254 |
| Welsh | 43.3 /100 | #178 | Average $102,151 |
| South Americans | 39.7 /100 | #179 | Fair $101,856 |
| French Canadians | 37.0 /100 | #180 | Fair $101,634 |
| Spaniards | 36.8 /100 | #181 | Fair $101,617 |
| Tsimshian | 35.9 /100 | #182 | Fair $101,543 |
| Kenyans | 34.5 /100 | #183 | Fair $101,417 |
| Immigrants | Costa Rica | 33.7 /100 | #184 | Fair $101,354 |
| Dutch | 31.9 /100 | #185 | Fair $101,192 |
| Celtics | 31.3 /100 | #186 | Fair $101,139 |
| Tlingit-Haida | 30.8 /100 | #187 | Fair $101,092 |
| Guamanians/Chamorros | 30.5 /100 | #188 | Fair $101,061 |
| Immigrants | Portugal | 29.6 /100 | #189 | Fair $100,984 |
| Immigrants | Immigrants | 29.4 /100 | #190 | Fair $100,962 |
| Colombians | 27.2 /100 | #191 | Fair $100,750 |
| Immigrants | Kenya | 26.5 /100 | #192 | Fair $100,679 |
| Iraqis | 26.3 /100 | #193 | Fair $100,658 |
| Uruguayans | 26.3 /100 | #194 | Fair $100,656 |
| Immigrants | South America | 23.9 /100 | #195 | Fair $100,414 |
| Samoans | 23.3 /100 | #196 | Fair $100,344 |