Belizean vs Barbadian Median Female Earnings
COMPARE
Belizean
Barbadian
Median Female Earnings
Median Female Earnings Comparison
Belizeans
Barbadians
$37,429
MEDIAN FEMALE EARNINGS
0.9/ 100
METRIC RATING
258th/ 347
METRIC RANK
$41,261
MEDIAN FEMALE EARNINGS
96.3/ 100
METRIC RATING
117th/ 347
METRIC RANK
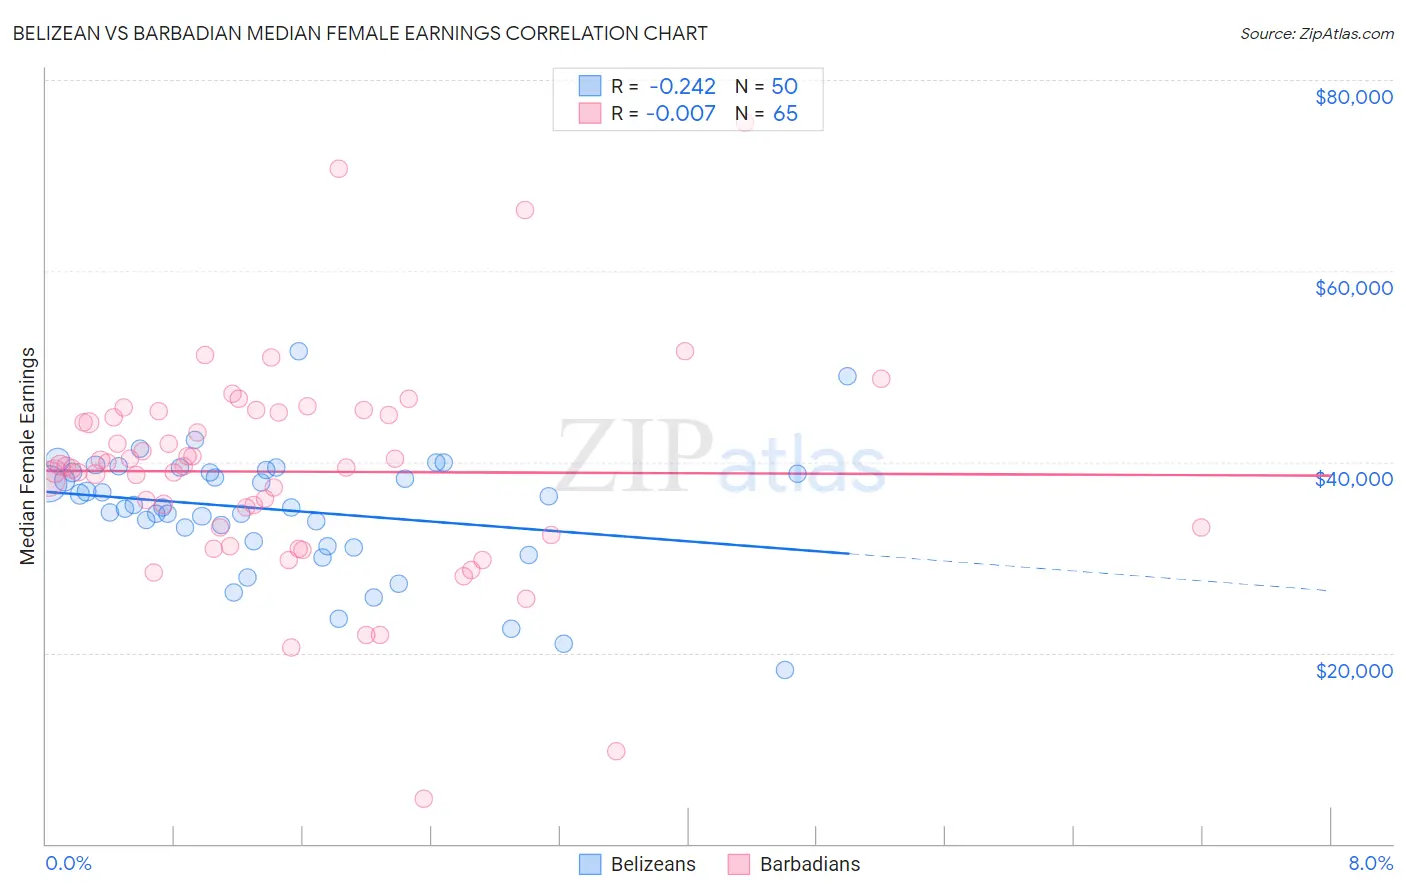
Belizean vs Barbadian Median Female Earnings Correlation Chart
The statistical analysis conducted on geographies consisting of 144,203,712 people shows a weak negative correlation between the proportion of Belizeans and median female earnings in the United States with a correlation coefficient (R) of -0.242 and weighted average of $37,429. Similarly, the statistical analysis conducted on geographies consisting of 141,295,506 people shows no correlation between the proportion of Barbadians and median female earnings in the United States with a correlation coefficient (R) of -0.007 and weighted average of $41,261, a difference of 10.2%.
Median Female Earnings Correlation Summary
| Measurement | Belizean | Barbadian |
| Minimum | $18,201 | $4,682 |
| Maximum | $51,565 | $75,551 |
| Range | $33,364 | $70,869 |
| Mean | $34,988 | $38,965 |
| Median | $35,337 | $39,507 |
| Interquartile 25% (IQ1) | $31,707 | $32,736 |
| Interquartile 75% (IQ3) | $38,920 | $45,058 |
| Interquartile Range (IQR) | $7,213 | $12,323 |
| Standard Deviation (Sample) | $6,353 | $11,409 |
| Standard Deviation (Population) | $6,289 | $11,321 |
Similar Demographics by Median Female Earnings
Demographics Similar to Belizeans by Median Female Earnings
In terms of median female earnings, the demographic groups most similar to Belizeans are Scotch-Irish ($37,383, a difference of 0.12%), Hawaiian ($37,497, a difference of 0.18%), Samoan ($37,498, a difference of 0.19%), Colville ($37,514, a difference of 0.23%), and Dutch ($37,339, a difference of 0.24%).
| Demographics | Rating | Rank | Median Female Earnings |
| Welsh | 2.1 /100 | #251 | Tragic $37,856 |
| Immigrants | Dominica | 2.0 /100 | #252 | Tragic $37,825 |
| Danes | 1.6 /100 | #253 | Tragic $37,730 |
| Whites/Caucasians | 1.1 /100 | #254 | Tragic $37,531 |
| Colville | 1.1 /100 | #255 | Tragic $37,514 |
| Samoans | 1.0 /100 | #256 | Tragic $37,498 |
| Hawaiians | 1.0 /100 | #257 | Tragic $37,497 |
| Belizeans | 0.9 /100 | #258 | Tragic $37,429 |
| Scotch-Irish | 0.8 /100 | #259 | Tragic $37,383 |
| Dutch | 0.7 /100 | #260 | Tragic $37,339 |
| Malaysians | 0.7 /100 | #261 | Tragic $37,298 |
| Venezuelans | 0.7 /100 | #262 | Tragic $37,282 |
| German Russians | 0.5 /100 | #263 | Tragic $37,105 |
| Salvadorans | 0.4 /100 | #264 | Tragic $37,083 |
| Immigrants | Belize | 0.4 /100 | #265 | Tragic $37,056 |
Demographics Similar to Barbadians by Median Female Earnings
In terms of median female earnings, the demographic groups most similar to Barbadians are Immigrants from Brazil ($41,273, a difference of 0.030%), Immigrants from England ($41,277, a difference of 0.040%), Korean ($41,276, a difference of 0.040%), Macedonian ($41,286, a difference of 0.060%), and Immigrants from North America ($41,319, a difference of 0.14%).
| Demographics | Rating | Rank | Median Female Earnings |
| Immigrants | Western Asia | 97.0 /100 | #110 | Exceptional $41,375 |
| Immigrants | Canada | 97.0 /100 | #111 | Exceptional $41,373 |
| Immigrants | North America | 96.7 /100 | #112 | Exceptional $41,319 |
| Macedonians | 96.4 /100 | #113 | Exceptional $41,286 |
| Immigrants | England | 96.4 /100 | #114 | Exceptional $41,277 |
| Koreans | 96.4 /100 | #115 | Exceptional $41,276 |
| Immigrants | Brazil | 96.4 /100 | #116 | Exceptional $41,273 |
| Barbadians | 96.3 /100 | #117 | Exceptional $41,261 |
| Immigrants | Lebanon | 95.6 /100 | #118 | Exceptional $41,183 |
| Immigrants | Philippines | 95.0 /100 | #119 | Exceptional $41,114 |
| Immigrants | Kuwait | 94.4 /100 | #120 | Exceptional $41,055 |
| Croatians | 93.7 /100 | #121 | Exceptional $40,993 |
| Immigrants | Jordan | 93.5 /100 | #122 | Exceptional $40,977 |
| Guyanese | 93.4 /100 | #123 | Exceptional $40,973 |
| Trinidadians and Tobagonians | 93.2 /100 | #124 | Exceptional $40,958 |