Belizean vs Immigrants from Nigeria Median Female Earnings
COMPARE
Belizean
Immigrants from Nigeria
Median Female Earnings
Median Female Earnings Comparison
Belizeans
Immigrants from Nigeria
$37,429
MEDIAN FEMALE EARNINGS
0.9/ 100
METRIC RATING
258th/ 347
METRIC RANK
$39,294
MEDIAN FEMALE EARNINGS
30.2/ 100
METRIC RATING
193rd/ 347
METRIC RANK
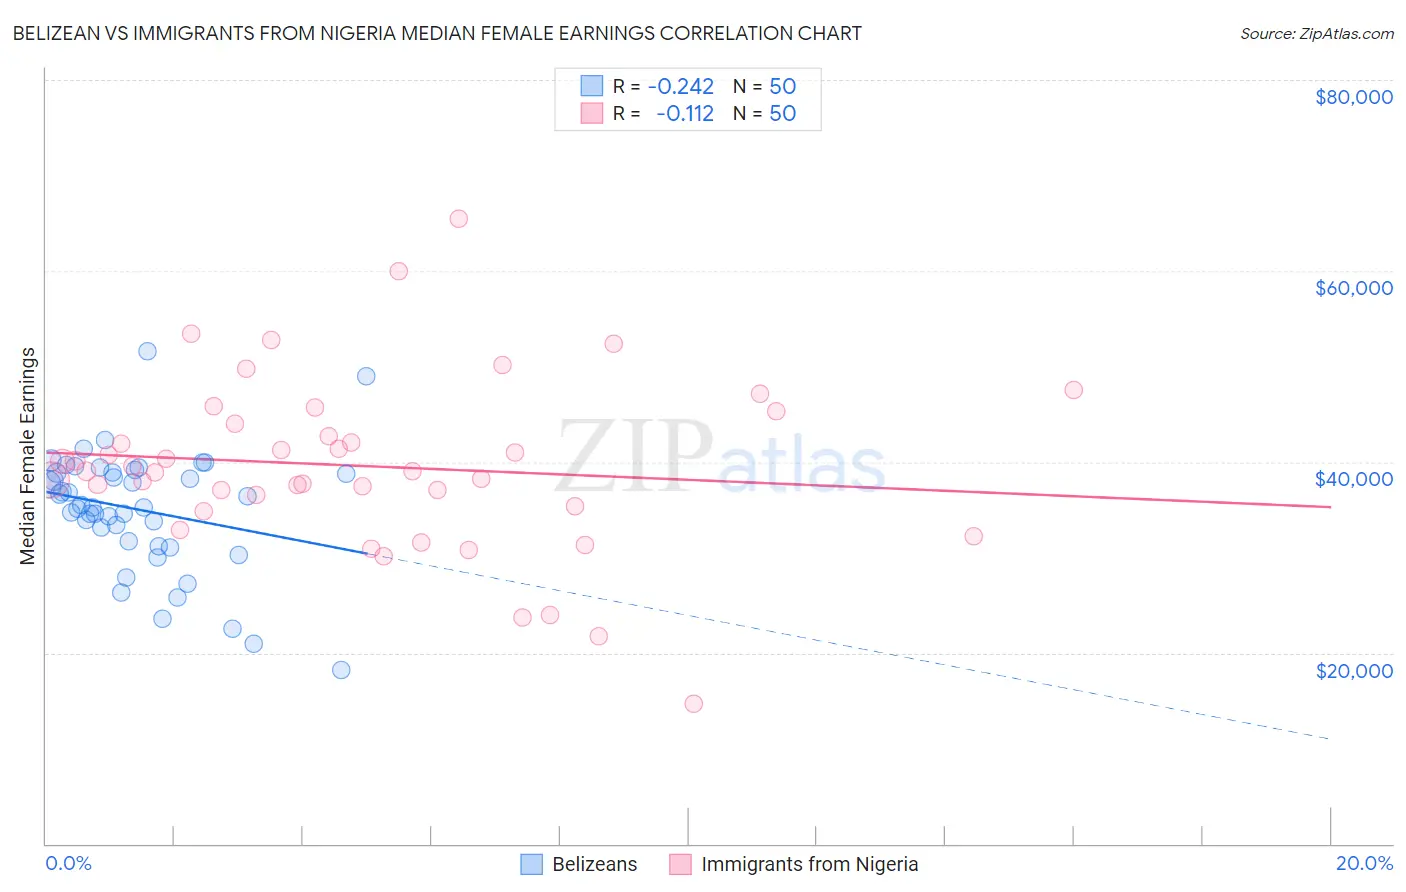
Belizean vs Immigrants from Nigeria Median Female Earnings Correlation Chart
The statistical analysis conducted on geographies consisting of 144,203,712 people shows a weak negative correlation between the proportion of Belizeans and median female earnings in the United States with a correlation coefficient (R) of -0.242 and weighted average of $37,429. Similarly, the statistical analysis conducted on geographies consisting of 283,458,757 people shows a poor negative correlation between the proportion of Immigrants from Nigeria and median female earnings in the United States with a correlation coefficient (R) of -0.112 and weighted average of $39,294, a difference of 5.0%.
Median Female Earnings Correlation Summary
| Measurement | Belizean | Immigrants from Nigeria |
| Minimum | $18,201 | $14,696 |
| Maximum | $51,565 | $65,528 |
| Range | $33,364 | $50,832 |
| Mean | $34,988 | $39,545 |
| Median | $35,337 | $39,021 |
| Interquartile 25% (IQ1) | $31,707 | $35,340 |
| Interquartile 75% (IQ3) | $38,920 | $44,001 |
| Interquartile Range (IQR) | $7,213 | $8,661 |
| Standard Deviation (Sample) | $6,353 | $9,154 |
| Standard Deviation (Population) | $6,289 | $9,062 |
Similar Demographics by Median Female Earnings
Demographics Similar to Belizeans by Median Female Earnings
In terms of median female earnings, the demographic groups most similar to Belizeans are Scotch-Irish ($37,383, a difference of 0.12%), Hawaiian ($37,497, a difference of 0.18%), Samoan ($37,498, a difference of 0.19%), Colville ($37,514, a difference of 0.23%), and Dutch ($37,339, a difference of 0.24%).
| Demographics | Rating | Rank | Median Female Earnings |
| Welsh | 2.1 /100 | #251 | Tragic $37,856 |
| Immigrants | Dominica | 2.0 /100 | #252 | Tragic $37,825 |
| Danes | 1.6 /100 | #253 | Tragic $37,730 |
| Whites/Caucasians | 1.1 /100 | #254 | Tragic $37,531 |
| Colville | 1.1 /100 | #255 | Tragic $37,514 |
| Samoans | 1.0 /100 | #256 | Tragic $37,498 |
| Hawaiians | 1.0 /100 | #257 | Tragic $37,497 |
| Belizeans | 0.9 /100 | #258 | Tragic $37,429 |
| Scotch-Irish | 0.8 /100 | #259 | Tragic $37,383 |
| Dutch | 0.7 /100 | #260 | Tragic $37,339 |
| Malaysians | 0.7 /100 | #261 | Tragic $37,298 |
| Venezuelans | 0.7 /100 | #262 | Tragic $37,282 |
| German Russians | 0.5 /100 | #263 | Tragic $37,105 |
| Salvadorans | 0.4 /100 | #264 | Tragic $37,083 |
| Immigrants | Belize | 0.4 /100 | #265 | Tragic $37,056 |
Demographics Similar to Immigrants from Nigeria by Median Female Earnings
In terms of median female earnings, the demographic groups most similar to Immigrants from Nigeria are Irish ($39,291, a difference of 0.010%), Immigrants ($39,328, a difference of 0.090%), Immigrants from Western Africa ($39,351, a difference of 0.14%), Uruguayan ($39,228, a difference of 0.17%), and Puget Sound Salish ($39,376, a difference of 0.21%).
| Demographics | Rating | Rank | Median Female Earnings |
| Colombians | 36.9 /100 | #186 | Fair $39,439 |
| Swedes | 36.0 /100 | #187 | Fair $39,421 |
| Bermudans | 35.9 /100 | #188 | Fair $39,418 |
| Senegalese | 34.2 /100 | #189 | Fair $39,384 |
| Puget Sound Salish | 33.9 /100 | #190 | Fair $39,376 |
| Immigrants | Western Africa | 32.7 /100 | #191 | Fair $39,351 |
| Immigrants | Immigrants | 31.7 /100 | #192 | Fair $39,328 |
| Immigrants | Nigeria | 30.2 /100 | #193 | Fair $39,294 |
| Irish | 30.0 /100 | #194 | Fair $39,291 |
| Uruguayans | 27.3 /100 | #195 | Fair $39,228 |
| Immigrants | Costa Rica | 25.6 /100 | #196 | Fair $39,186 |
| Assyrians/Chaldeans/Syriacs | 24.6 /100 | #197 | Fair $39,159 |
| Ecuadorians | 23.0 /100 | #198 | Fair $39,117 |
| Icelanders | 22.7 /100 | #199 | Fair $39,109 |
| Immigrants | Panama | 20.6 /100 | #200 | Fair $39,049 |