Belizean vs Bahamian Median Female Earnings
COMPARE
Belizean
Bahamian
Median Female Earnings
Median Female Earnings Comparison
Belizeans
Bahamians
$37,429
MEDIAN FEMALE EARNINGS
0.9/ 100
METRIC RATING
258th/ 347
METRIC RANK
$35,125
MEDIAN FEMALE EARNINGS
0.0/ 100
METRIC RATING
305th/ 347
METRIC RANK
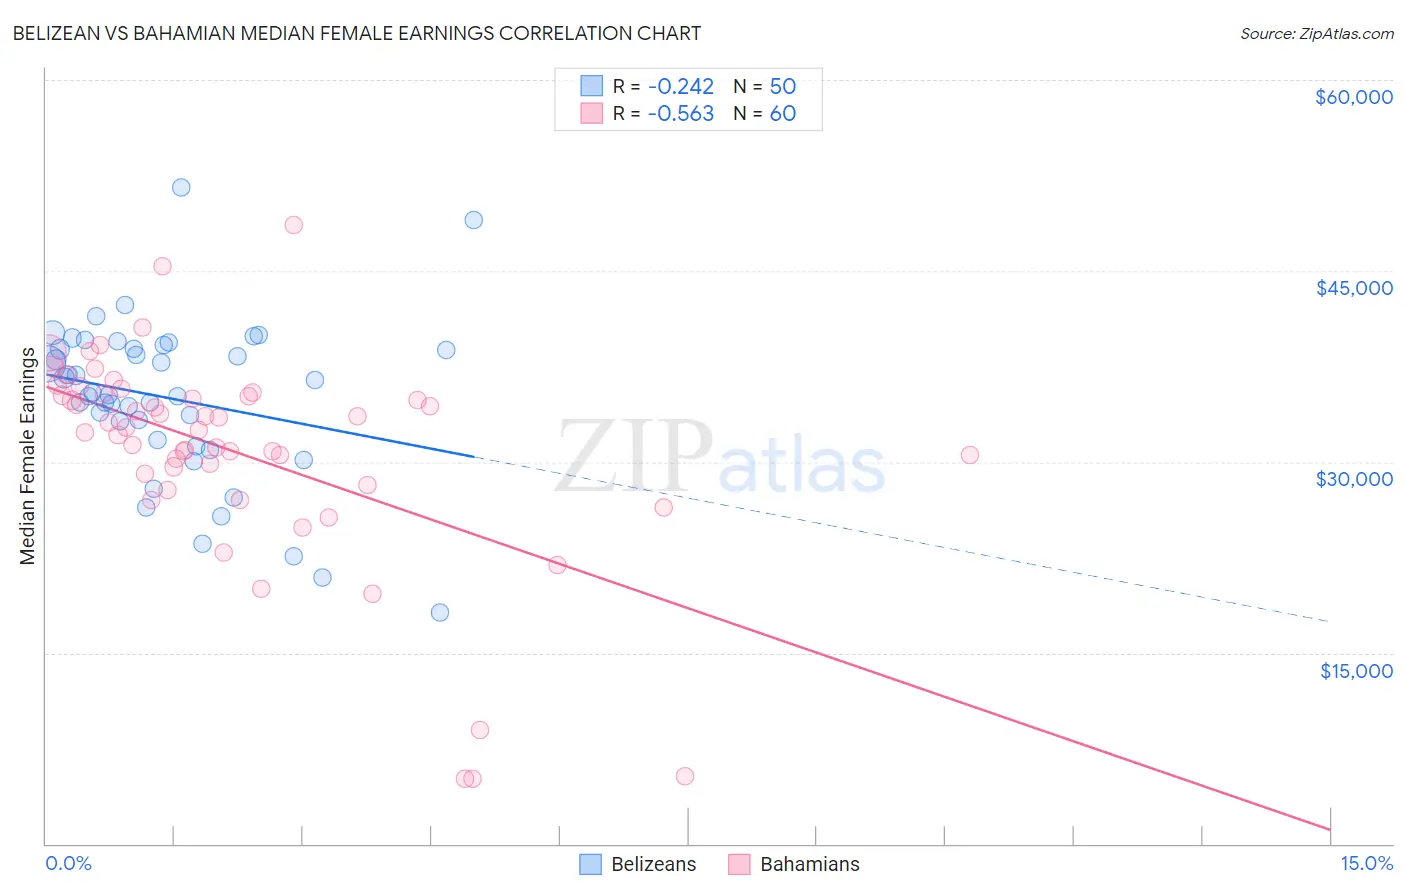
Belizean vs Bahamian Median Female Earnings Correlation Chart
The statistical analysis conducted on geographies consisting of 144,203,712 people shows a weak negative correlation between the proportion of Belizeans and median female earnings in the United States with a correlation coefficient (R) of -0.242 and weighted average of $37,429. Similarly, the statistical analysis conducted on geographies consisting of 112,672,199 people shows a substantial negative correlation between the proportion of Bahamians and median female earnings in the United States with a correlation coefficient (R) of -0.563 and weighted average of $35,125, a difference of 6.6%.
Median Female Earnings Correlation Summary
| Measurement | Belizean | Bahamian |
| Minimum | $18,201 | $5,063 |
| Maximum | $51,565 | $48,590 |
| Range | $33,364 | $43,527 |
| Mean | $34,988 | $30,808 |
| Median | $35,337 | $32,617 |
| Interquartile 25% (IQ1) | $31,707 | $28,645 |
| Interquartile 75% (IQ3) | $38,920 | $35,290 |
| Interquartile Range (IQR) | $7,213 | $6,645 |
| Standard Deviation (Sample) | $6,353 | $8,476 |
| Standard Deviation (Population) | $6,289 | $8,405 |
Similar Demographics by Median Female Earnings
Demographics Similar to Belizeans by Median Female Earnings
In terms of median female earnings, the demographic groups most similar to Belizeans are Scotch-Irish ($37,383, a difference of 0.12%), Hawaiian ($37,497, a difference of 0.18%), Samoan ($37,498, a difference of 0.19%), Colville ($37,514, a difference of 0.23%), and Dutch ($37,339, a difference of 0.24%).
| Demographics | Rating | Rank | Median Female Earnings |
| Welsh | 2.1 /100 | #251 | Tragic $37,856 |
| Immigrants | Dominica | 2.0 /100 | #252 | Tragic $37,825 |
| Danes | 1.6 /100 | #253 | Tragic $37,730 |
| Whites/Caucasians | 1.1 /100 | #254 | Tragic $37,531 |
| Colville | 1.1 /100 | #255 | Tragic $37,514 |
| Samoans | 1.0 /100 | #256 | Tragic $37,498 |
| Hawaiians | 1.0 /100 | #257 | Tragic $37,497 |
| Belizeans | 0.9 /100 | #258 | Tragic $37,429 |
| Scotch-Irish | 0.8 /100 | #259 | Tragic $37,383 |
| Dutch | 0.7 /100 | #260 | Tragic $37,339 |
| Malaysians | 0.7 /100 | #261 | Tragic $37,298 |
| Venezuelans | 0.7 /100 | #262 | Tragic $37,282 |
| German Russians | 0.5 /100 | #263 | Tragic $37,105 |
| Salvadorans | 0.4 /100 | #264 | Tragic $37,083 |
| Immigrants | Belize | 0.4 /100 | #265 | Tragic $37,056 |
Demographics Similar to Bahamians by Median Female Earnings
In terms of median female earnings, the demographic groups most similar to Bahamians are Fijian ($35,114, a difference of 0.030%), Sioux ($35,063, a difference of 0.18%), Immigrants from Bahamas ($35,027, a difference of 0.28%), Honduran ($35,013, a difference of 0.32%), and Chippewa ($35,003, a difference of 0.35%).
| Demographics | Rating | Rank | Median Female Earnings |
| Immigrants | Micronesia | 0.0 /100 | #298 | Tragic $35,477 |
| Immigrants | Guatemala | 0.0 /100 | #299 | Tragic $35,444 |
| Yuman | 0.0 /100 | #300 | Tragic $35,377 |
| Pima | 0.0 /100 | #301 | Tragic $35,326 |
| Blacks/African Americans | 0.0 /100 | #302 | Tragic $35,315 |
| Immigrants | Latin America | 0.0 /100 | #303 | Tragic $35,307 |
| Crow | 0.0 /100 | #304 | Tragic $35,266 |
| Bahamians | 0.0 /100 | #305 | Tragic $35,125 |
| Fijians | 0.0 /100 | #306 | Tragic $35,114 |
| Sioux | 0.0 /100 | #307 | Tragic $35,063 |
| Immigrants | Bahamas | 0.0 /100 | #308 | Tragic $35,027 |
| Hondurans | 0.0 /100 | #309 | Tragic $35,013 |
| Chippewa | 0.0 /100 | #310 | Tragic $35,003 |
| Ute | 0.0 /100 | #311 | Tragic $34,960 |
| Yaqui | 0.0 /100 | #312 | Tragic $34,943 |